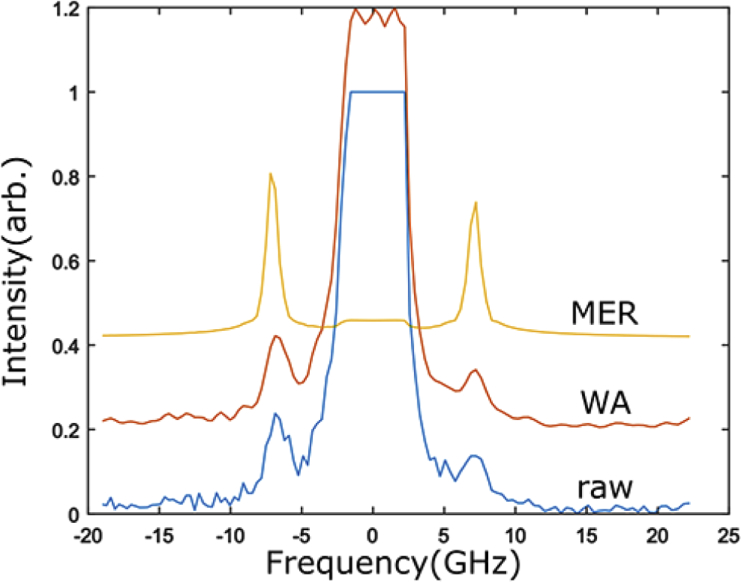
Fig. 3.
Example of a typical unprocessed experimental Brillouin spectrum of distilled water obtained using a 100 ms acquisition time () (blue). Corresponding reconstructed spectra as found using the WA (orange) and MER (yellow) algorithms are also shown. Note that spectra have been vertically shifted to improve visibility.

