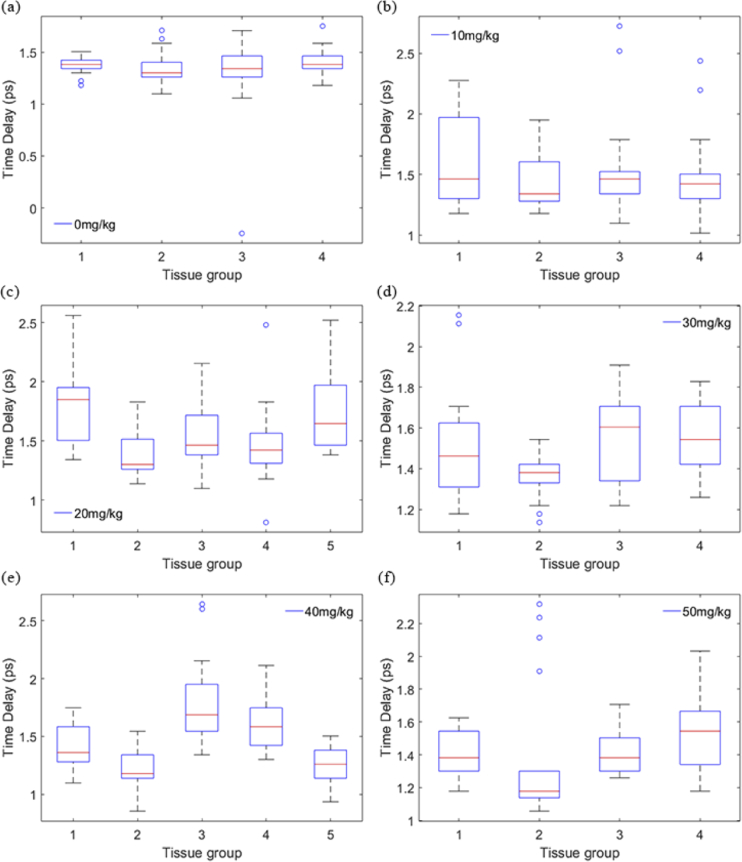
Fig. 5.
Boxplots showing the abnormal spectra in each tissue in one group with the parameter . (a) Boxplot result of 0 mg/kg group. (b) Boxplot result of 10 mg/kg group. (c) Boxplot result of 20 mg/kg group. (d) Boxplot result of 30 mg/kg group. (e) Boxplot result of 40 mg/kg group. (f) Boxplot result of 50 mg/kg group.

