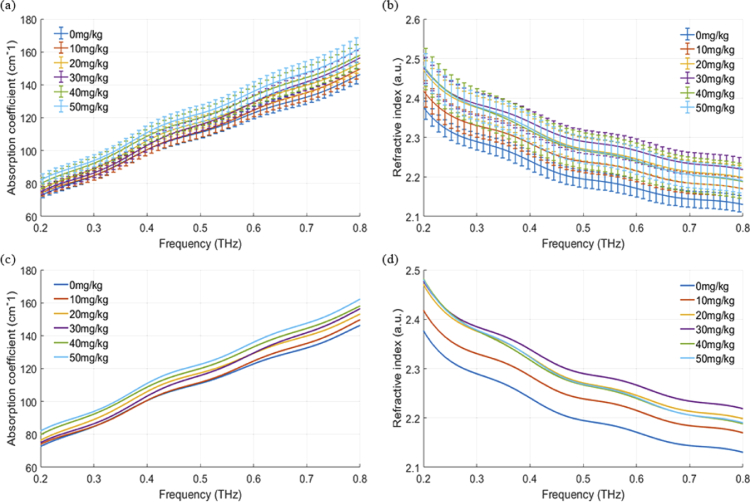
Fig. 7.
Average spectra of both absorption coefficient and refractive index of six groups. (a) Average absorption coefficient spectra of each group with error bars. (b) Average refractive index spectra of each group with error bars. (c) Average absorption coefficient spectra of each group. (d) Average refractive index spectra of each group.

