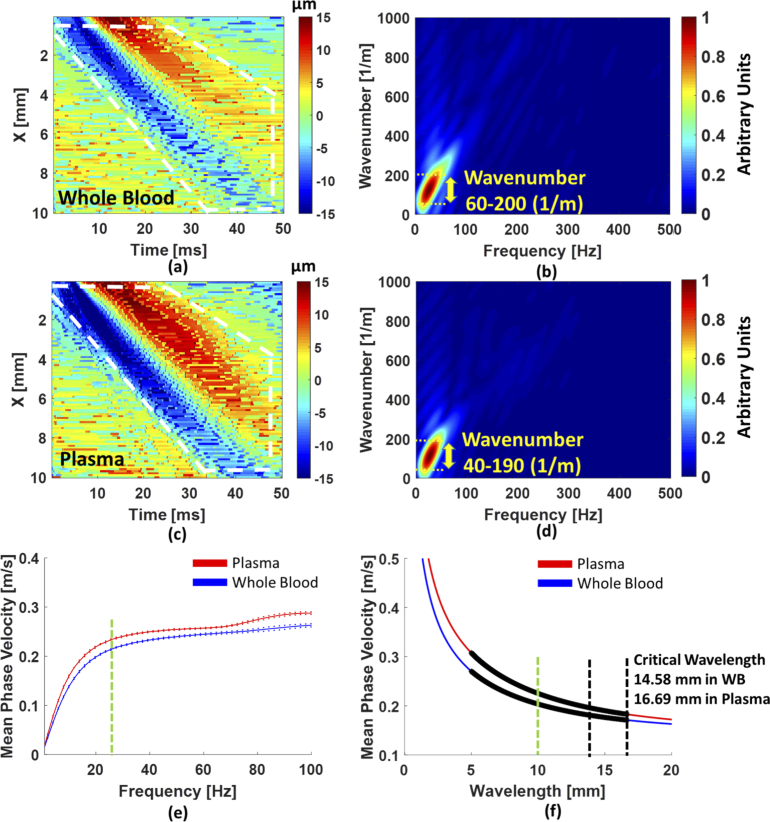
Fig. 5.
The phase velocities of capillary waves in whole blood and plasma were exhibited. (a) and (c) are the 2D-OCT lateral time to peak displacement image in whole blood and in plasma, respectively. The longer waves (white dashed quadrilateral) in whole blood and plasma were clearly observed. (b) and (d) The k-space of longer waves in whole blood and in plasma were displayed and the wavenumber range was 70% centered at the peak of the magnitude distribution (yellow arrow). (e) The mean dispersion curves with standard deviations in plasma (red line) and whole blood (blue line) were presented as the experimental results. (f) The phase velocities from the theory in plasma and whole blood were represented. The wavelengths were selected by the range of wavenumbers in (b) and (d). The colorbars in (a) and (c) indicate surface displacement.

