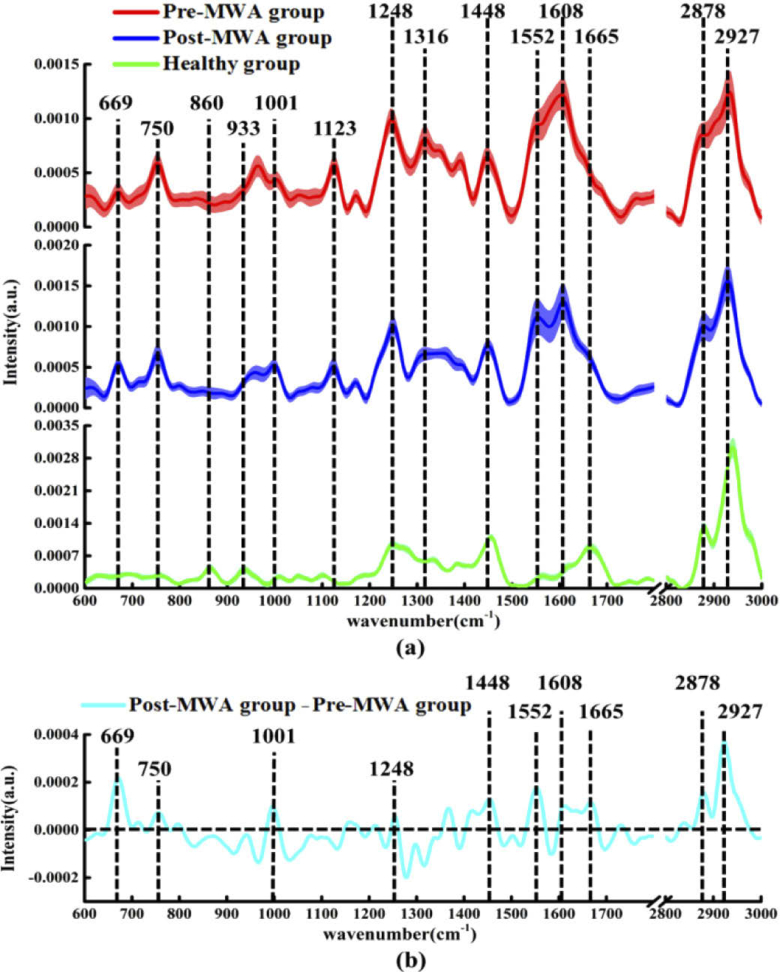
Fig. 1.
(a) The mean ± standard deviations (SD) of normalized spectra in cancerous tissue of the Pre-MWA group, Post-MWA group and healthy group, shading area represents standard deviations. (b) The differential spectra calculated from the mean Raman spectra between the cancerous tissue of Pre-MWA group and Post-MWA groups.

