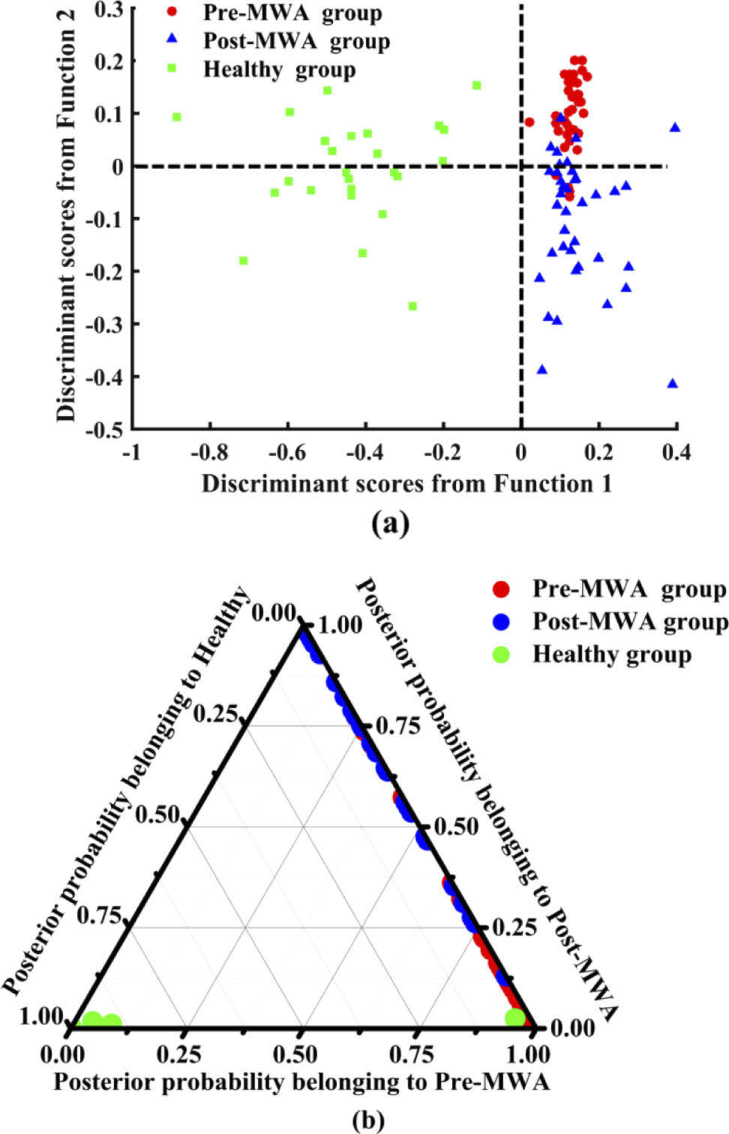
Fig. 4.
(a) represents the scatter plot of linear discriminant scores for three types of tissue; (b) displays two-dimensional ternary plot of the posterior probabilities belonging to the Pre-MWA group, Post-MWA group and healthy lung tissue calculated from the Raman spectral data set, using the PCA-LDA discriminant model combined with LOOCV method.

