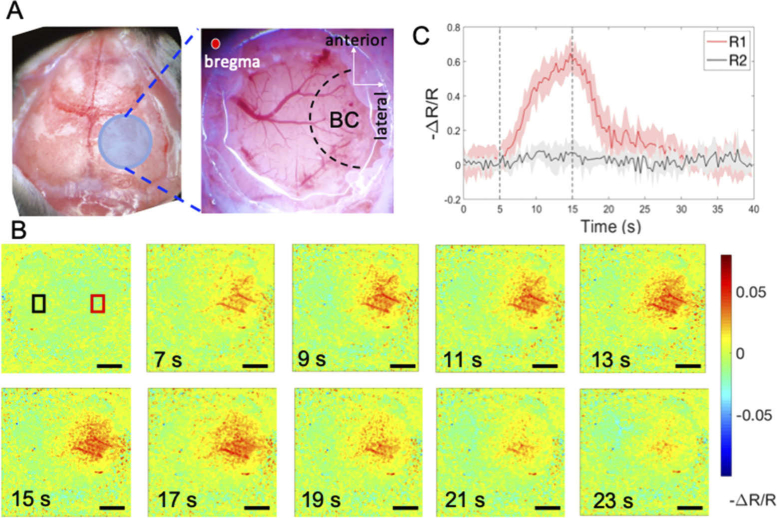
Fig. 2.
Wide-field reflectance mapping of the mouse barrel cortex (BC) during whisker stimulation. A) Schematic of mouse functional cortex map and photography of the cranial window delineating the relative location of BC. B) Sequence of reflectance images indicating the relative changes in HbT contents at BC in response to 10 s of whisker stimulation; C) Time course of the relative reflectance changes averaged over a region centered on the activated area R1 (indicated by red box) and non-activated region R2 (indicated by black box) respectively. Scale bar = 1 mm.

