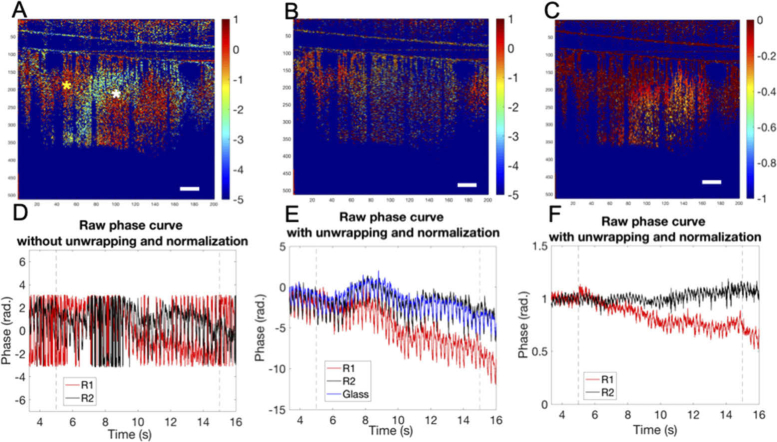
Fig. 3.
Cross-sectional stimulus-induced relative phase changes (ΔP/P) mapping and curves obtained from OCT imaging. A) Relative phase change images at 12s (during whisker stimulation) without using phase unwrapping and normalization; B) Relative phase change images at 14s with phase unwrapping but without normalization; C) Relative phase change images at 14s with phase unwrapping and normalization; D), E) and F) are the corresponding time course (from 3.33 s to 15.66 s) raw phase curves for the pixels located at R1 indicated by the white star (red curve) and R2 indicated by the yellow star (black curve) in A), respectively. Scale bar = 300 µm.

