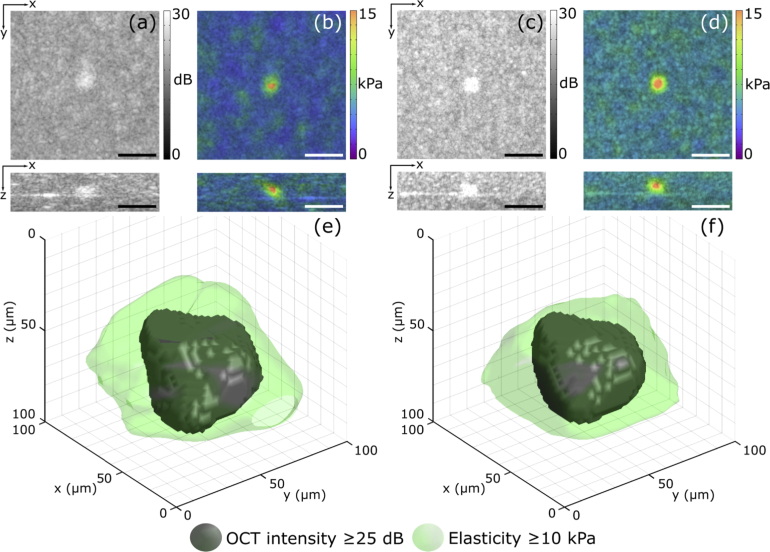
Fig. 3.
OCT, QME and 3-D visualization of an inclusion phantom. (a) OCT and (b) OCT/QME overlay images of the inclusion imaged using common-path. (c) OCT and (d) OCT/QME overlay images of the same inclusion imaged using dual-arm. (e) and (f) are 3-D visualizations of the inclusion acquired using common-path, and dual-arm, respectively. In (e) and (f), the grey feature is the structure of the inclusion from the OCT intensity and the volume with elasticity above 10 kPa is overlaid in green. Scale bars represent 100 µm.

