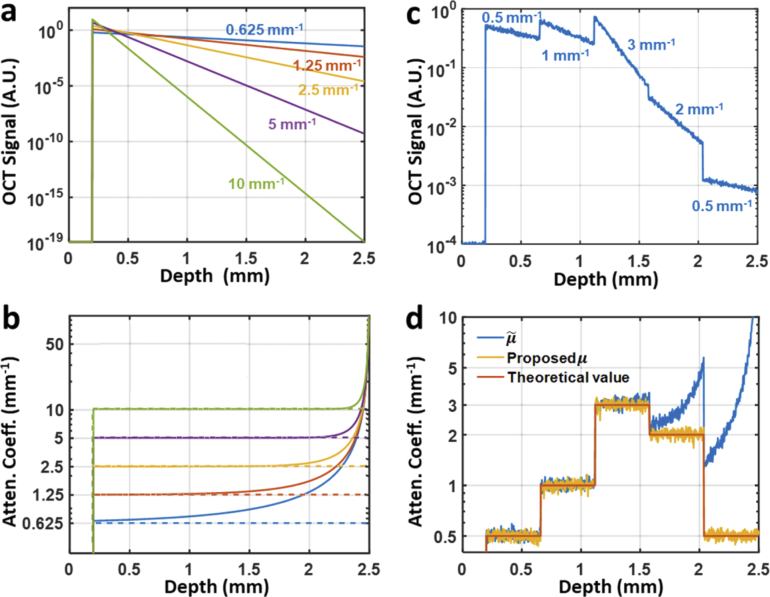
Fig. 2.
Numerical simulation results of single- and multiple-layer digital phantoms. a. Simulated OCT signals (in logarithmic scale) of five different single-layer phantoms, with the corresponding attenuation coefficients indicated in matching color. b. Attenuation profiles recovered from OCT signals in a with both Vermeer’s method (solid lines) and the new algorithm herein proposed (dashed lines). c. Simulated OCT signal (in logarithmic scale) from a noisy 5-layer heterogeneous phantom with attenuation coefficients of 0.5 mm−1, 1 mm−1, 3 mm−1, 2 mm−1, and 0.5 mm−1 (from top to bottom), respectively. d. Attenuation profiles recovered from the OCT signal in c with Vermeer’s method (blue curve) and the new algorithm herein proposed (yellow curve).

