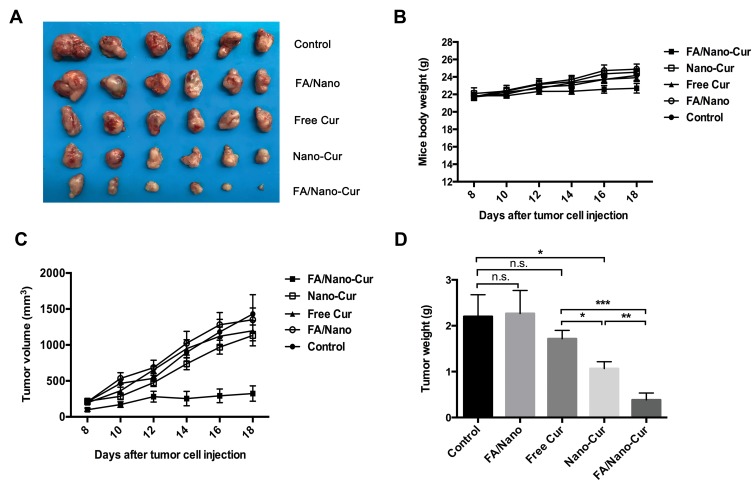
Figure 5.
In vivo anti-tumor ability assessment of different treatments. The photograph of subcutaneous tumors from different treatment groups (A), the boy weight change curve of mice in different groups (B), the tumor growth curve of mice from different treatment groups (C) and the tumor weight of mice from different treatment groups (D) (*P<0.05, **P<0.01, ***P<0.001).

