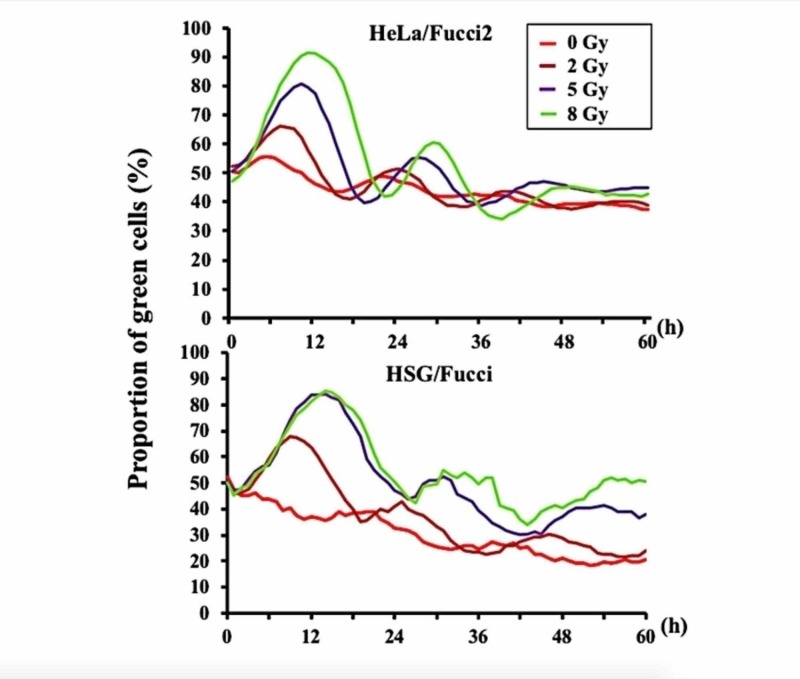
Figure 4. Curves representing the proportion of green S/G2/M phase HeLa/Fucci2 and HSG/Fucci cells after irradiation.
Modified from the data included in reference 14 (Iwata H, Shuto T, Kamei S, et al.: Effects of proton beams and X rays on the cell cycle of fluorescent ubiquitination-based cell cycle indicator (Fucci)-expressing cells. Int J Radiat Oncol Biol Phys. 2018, 102:e154. 10.1016/j.ijrobp.2018.07.602)

