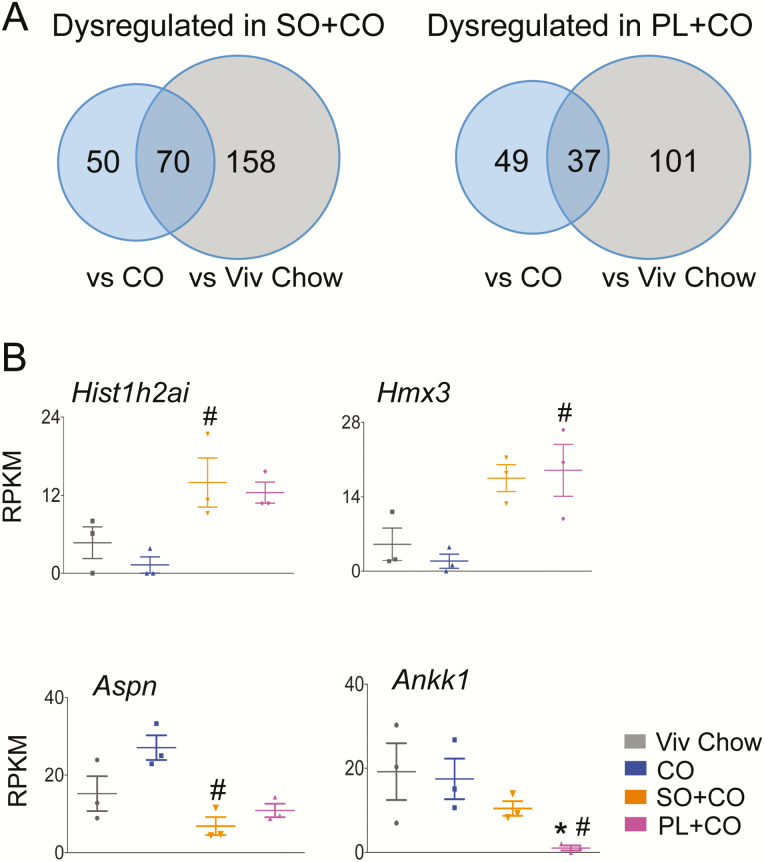
Figure 3.
Comparison of differentially expressed hypothalamic genes in different diet groups. A, Venn diagram of number of genes dysregulated in left, SO + CO, and right, PL + CO vs CO and Viv chow diets (≥1.5-fold, P and Padj ≤.05). B, Absolute expression levels from RNA sequencing (RNA-seq) of genes that are most dysregulated between SO + CO, PL + CO, or both soybean oil diets vs CO. Statistically different from #CO, *Viv chow. CO diets enriched in conventional soybean oil (SO + CO), genetically modified Plenish (PL + CO), and stigmasterol (ST + CO).

