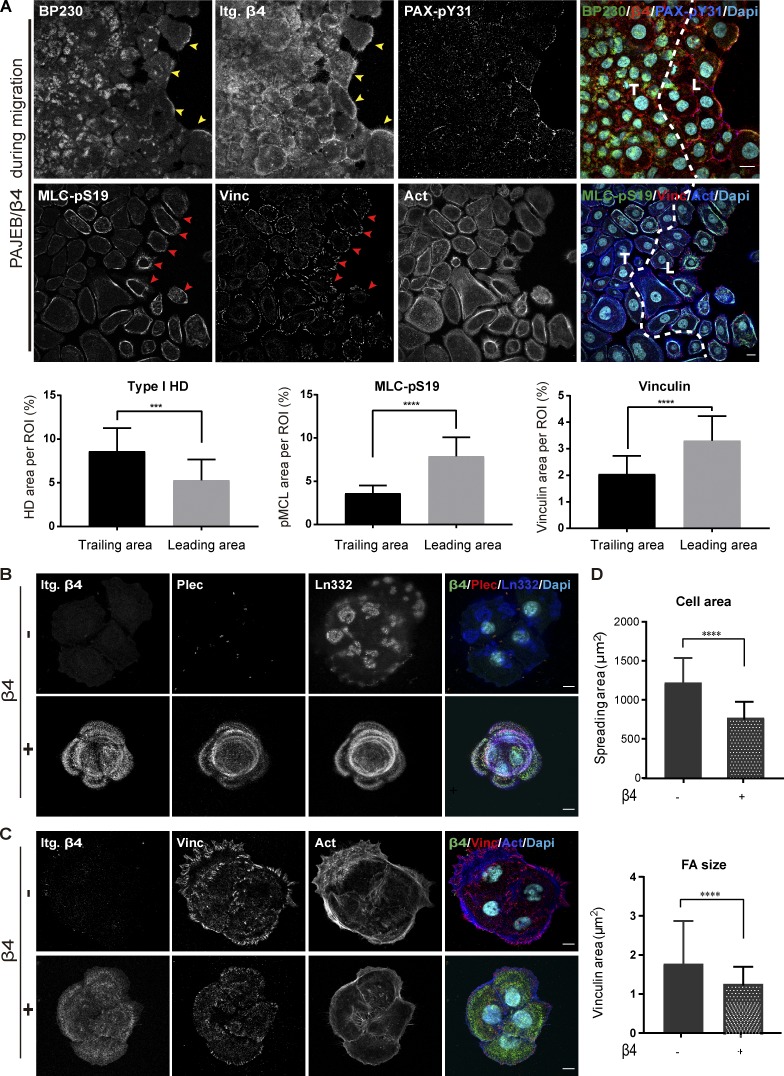
Figure 1.
Inverse correlation between integrin β4 expression and FA maturation. (A) Immunofluorescence confocal images of migrating PA-JEB/β4 keratinocytes stained for BP230 (green), integrin β4 (Itg. β4; red), phosphorylated paxillin (PAX-pY31; blue), phosphorylated MLC (MLC-pS19; green), vinculin (Vinc; red), and actin (Act; blue) 72 h after creating the gap. Nuclei were counterstained with DAPI (cyan). T means the trailing area, while L means the leading area of migrating cell monolayer. Yellow arrowheads indicate the enrichment of hemidesmosomal structure at the leading border, and red arrowheads indicate the higher level of MLC-pS19 and larger FAs in the leader cells. Scale bars: 20 µm. For quantification, type I HD (based on β4 and BP230 colocalization), MLC-pS19, and vinculin-positive areas are calculated as a percentage of the total ROI area. The values represent the mean (± SD) of three independent experiments, with ∼18 images per experiment. ***, P < 0. 001; ****, P < 0.0001. (B) Representative confocal fluorescence microscopy images of PA-JEB (β4 −) and PA-JEB/β4 (β4 +) keratinocytes cultured for 1 d in complete KGM medium and then switched to DMEM (10% FCS) for 16 h. Cells were immunostained for β4 (green), plectin (Plec; red), and laminin-332 (Ln332; blue). Colocalization of β4, plectin, and laminin-332 is visualized in the overlay images. Nuclei were counterstained with DAPI (cyan). (C) Cells were immunostained for β4 (green), vinculin (Vinc; red), and actin (Act; blue). Nuclei were counterstained with DAPI (cyan). Scale bars: 10 µm. (D) Cell area and FA size probed by vinculin were quantified with ImageJ. The values represent the mean (± SD) of three independent experiments, with ∼20 images per experiment. ****, P < 0.0001.

