Figure 6.
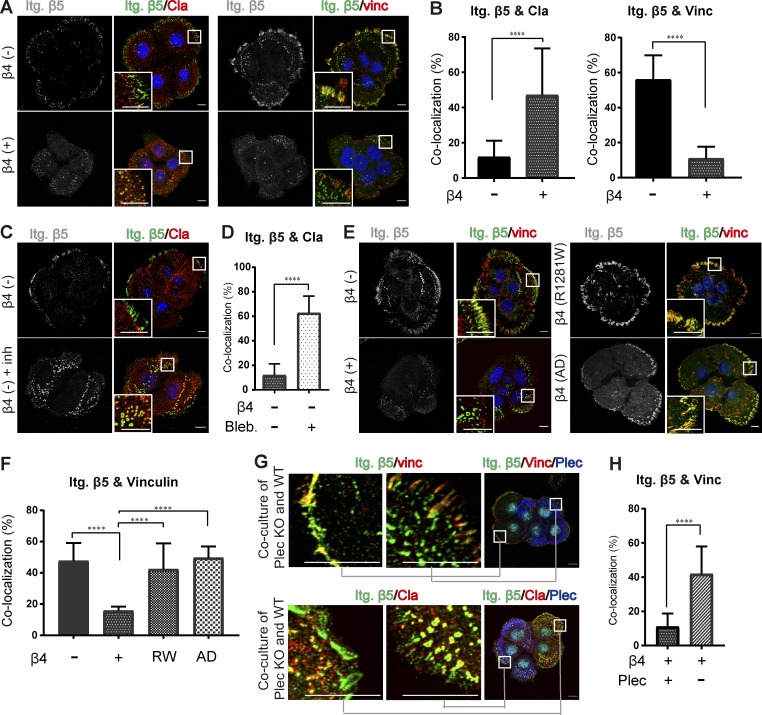
HD assembly controls the localization of integrin αVβ5. (A) Confocal images showing the distribution of β5 (green) together with either clathrin (Cla; red) or vinculin (Vinc; red) in β4 (−) and β4 (+) PA-JEB keratinocytes. Nuclei were counterstained with DAPI (blue). Scale bars: 10 µm. (B) Quantification of the colocalization of β5 with clathrin or vinculin. (C) Representative images showing integrin β5 clustering in clathrin lattices in β4 (−) cells, untreated or treated with the myosin inhibitor blebbistatin (20 µM) for 30 min. (D) Quantification of the colocalization of β5 with clathrin. (E) Confocal images showing the distribution and colocalization of β5 (green) and vinculin (red) in β4 (−), β4 (+), β4-R1281W, and β4-AD PA-JEB keratinocytes. Nuclei are shown in blue. Scale bars: 10 µm. (F) Quantification of the colocalization of β5 with vinculin. (G) Confocal images showing the distribution of β5 (green) together with either vinculin (red) or clathrin (red) in PA-JEB/β4 wild-type (close-up in the middle panel) and plectin knockout PA-JEB/β4 (close-up in the left panel) keratinocytes. Plectin is shown in blue, and nuclei are shown in cyan. Scale bars: 10 µm. (H) Quantification of the colocalization of β5 with vinculin. Data are presented as the mean (± SD) from three independent experiments, with ∼60 cells in total. ****, P < 0.0001.

