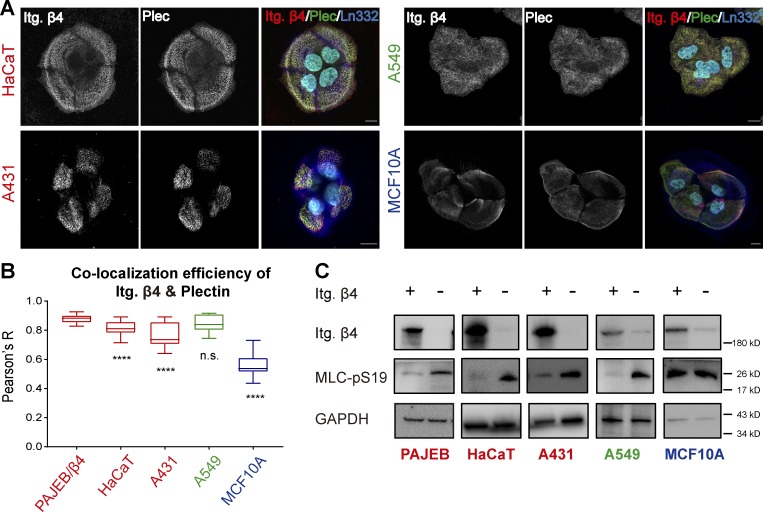
Figure 7.
HDs counteract actomyosin contractility in carcinoma cell lines. (A) Confocal images showing the distribution of β4 (red) together with plectin (green) and laminin (blue) in HaCaT, A431, A549, and MCF10A cells. Font in red indicates cells are skin derived, green indicates lung-derived cells, and blue indicates breast-derived cells. Scale bars: 10 µm. (B) Colocalization efficiency between the integrin β4 (Itg. β4) channel and the plectin channel, shown by Pearson’s R value. Data are presented as box-and-whisker plots in which the box extends the 25th to 75th percentiles, the middle line indicates the median, and whiskers go down to the smallest value and up to the largest (∼60 cells in total). The statistical analysis compares the PA-JEB/β4 group with each of the other groups. ****, P < 0.0001. (C) Western blot analysis of whole-cell lysates from PA-JEB, HaCaT, A431, A549, and MCF10A cells either expressing integrin β4 or lacking integrin β4 probed with antibodies against integrin β4, MLC-pS19, and GAPDH.

