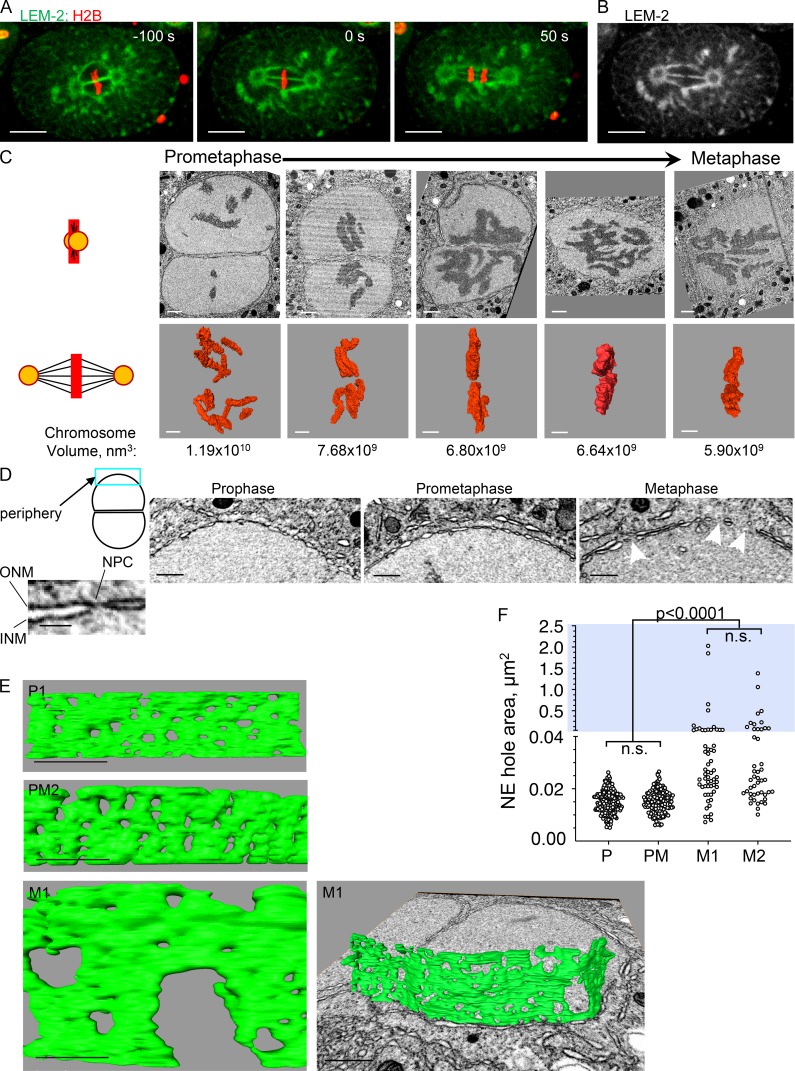
Figure 1.
Pronuclear membranes persist after prophase and become highly fenestrated in metaphase. (A and B) A one-cell embryo expressing the NE protein LEM-2 fused to GFP and histone H2B fused to mCherry was imaged at the indicated time points (metaphase = time 0). LEM-2 persists on the pronuclear membranes throughout mitosis, allowing the visualization of the pronuclear membranes between the two pronuclei. Merging of parental chromosome occurs at metaphase through a fenestration in the pronuclear interface membranes (B). Scale bars, 10 µm. (C) 2D cross sections from FIB-SEM image volumes of a subset of embryos (top row) and their reconstructed chromosomes (middle row) used in this study. The illustration on the left depicts the orientation of the centrosomes (orange circle) and spindle microtubules (black lines) relative to the images shown (chromosomes are in red). Some panels are from the plane of imaging and some are oblique 2D slices through a reconstructed FIB-SEM image volume, aligned orthogonal to the membrane interface. Embryos were ordered from prometaphase to metaphase by the degree of chromosome alignment and compaction, based on total chromosome volumes, shown below the 3D chromosome reconstructions. The pronuclei shown are from the following embryos (from left to right): PM2, PM4, M1, M2, and M3. Scale bars, 1 µm. (D) Examples of peripheral pronuclear membranes (blue rectangle in the cartoon depiction of two associated pronuclei) from prophase (P1), prometaphase (PM2), and metaphase (M1) embryos. The image on the far left is an enlargement of a membrane segment from the prometaphase embryos showing the two nuclear membranes (inner and outer) and the constriction that is seen where an NPC is embedded. Arrowheads in the “metaphase” panel point to holes that are larger than the expected size for NPC holes. Scale bars represent 500 nm, except in the inset, where the scale bar represents 100 nm. INM, inner nuclear membrane; ONM, outer nuclear membrane. (E) Segmented volumes of peripheral pronuclear membranes from the embryos shown in D. Scale bars represent 500 nm, except for the metaphase image on the right, for which the scale bar is 1 µm. P1, prophase; PM2, prometaphase; M1, metaphase. (F) Quantification of hole area in the peripheral pronuclear membranes of an embryo in prophase (P; embryo P1), prometaphase (PM; embryo PM2) and two embryos in metaphase (M1 and M2). For each embryo, data were derived from several segmented areas that were at least 1 µm2 in size. The total number of holes measured and number of areas per embryo were as follows: prophase, n = 213, nine areas; prometaphase, n = 153, nine areas; M1, n = 58, six areas; and M2, n = 46, five areas. Note that the y axis is discontinuous; blue background highlights the upper segment of the graph (hole area >0.04 µm2). Statistical analyses were done using the Kruskal-Wallis test with correction for multiple comparisons. The adjusted P values for the nonsignificant differences (n.s.) were >0.9999. See Fig. S1 for statistical analyses of the lower segment.

