Figure 2.
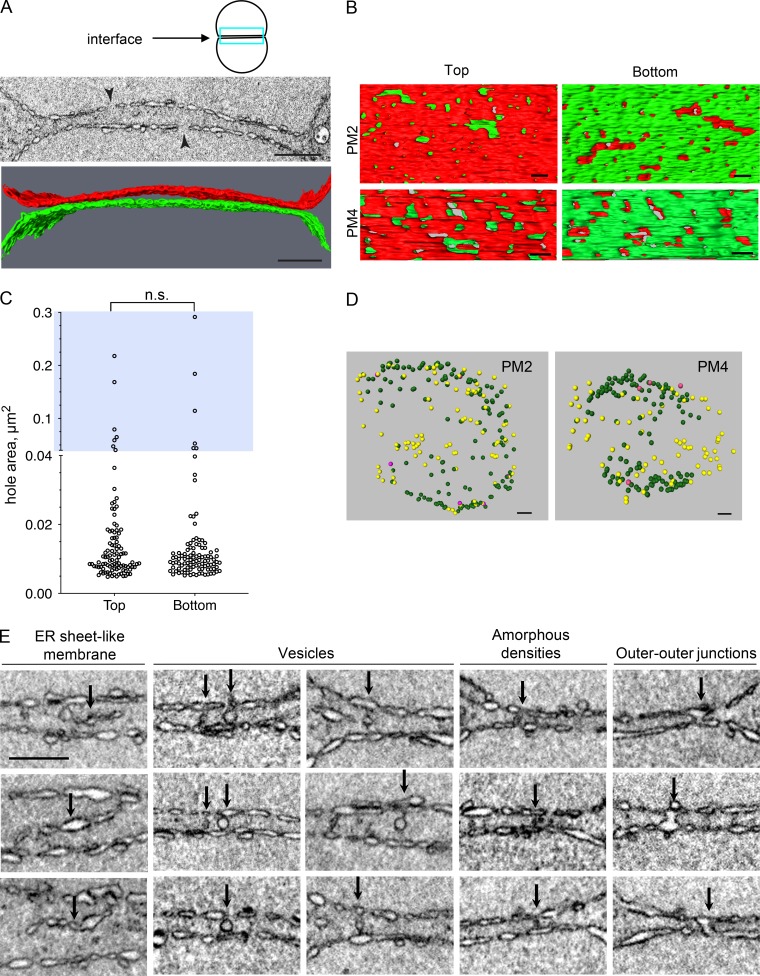
The interface membranes of the two pronuclei during prometaphase have enlarged fenestration and are connected by various structures. (A) A 2D cross section from a FIB-SEM image volume (top) and segmented subvolumes (bottom) of the pronuclear membranes at the interface (blue rectangle in the cartoon above) of a prometaphase embryo (PM2). The two arrowheads in the top panel are pointing to holes that are larger than the expected size for NPC holes. Scale bars, 1 µm. The membranes of the “top” pronucleus are labeled in red and the “bottom” pronucleus in green. (B) Segmented subvolumes from the interface membranes of two embryos in prometaphase, PM2 and PM4, viewed through the plane of the membrane interface: “top down” (left panels) or “bottom up” (right panels). The membranes of the two pronuclei were labeled in red or green, as in A. Scale bars, 200 nm. (C) Quantification of the hole areas of the top and bottom pronuclear membranes at the interface (as in A and B) of the PM2 embryo. n = 100 and 102 holes for the top and bottom surfaces, respectively. Note that the y axis is discontinuous; blue background highlights the upper segment of the graph (hole area >0.04 µm2). The differences between the two sets of hole sizes are not statistically significant (P = 0.605, two-tailed Mann-Whitney test). (D) Distribution of vesicles (yellow), amorphous densities (green), and outer–outer junctions (purple) present between the two pronuclei in two prometaphase embryos (PM2 and PM4). The interface is shown from a “top” view. Scale bars, 500 nm. (E) Examples of four types of structures that are seen between the two pronuclei at prometaphase (arrows), as indicated above each column. Images are from PM2 and PM4. Scale bar, 500 nm (applies to all panels).

