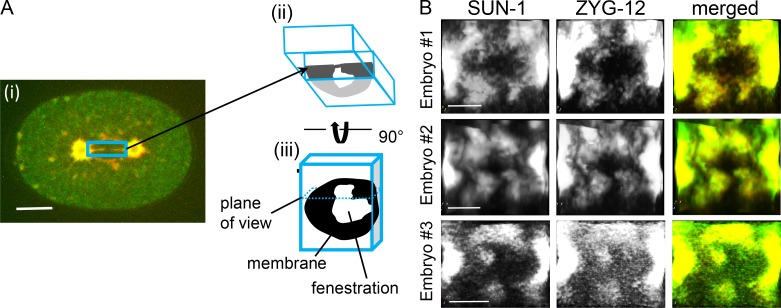
Figure S3.
SUN-1 and ZYG-12 distribution at the interface is largely overlapping. (A) A diagram of how the images in B were generated; to view the interface, metaphase one-cell embryos expressing SUN-1::mRuby (red) and ZYG-12::GFP (green) were imaged by confocal microscopy (i). A volume encompassing the interface (blue rectangle) was cropped (ii) using Aivia software and rotated by 90° (iii), resulting in the images shown in B. See Materials and methods for more details about the cropping process. Scale bar, 10 µm. (B) The interface areas of three different one-cell embryos expressing SUN-1::mRuby and ZYG-12::GFP at metaphase. Scale bars, 5 µm

