Figure 1.
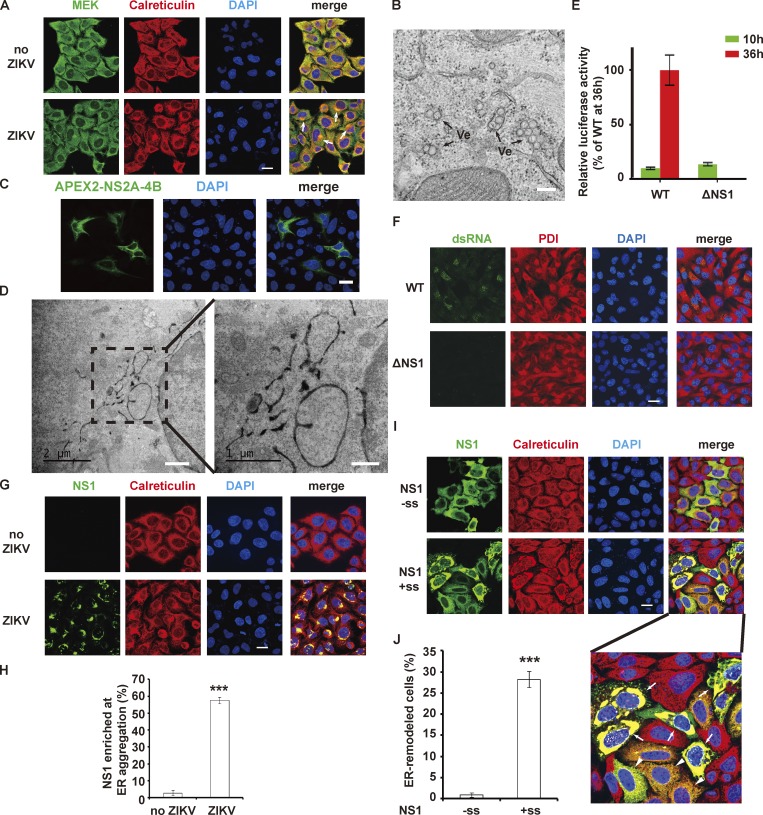
NS1 is essential for building replication compartment by ER remodeling. (A) ER morphology in ZIKV-infected HeLa cells. The arrows point to ER aggregation, indicating the replication compartments. Green, MEK (cytosolic marker); red, calreticulin (ER marker). (B) EM image showing ZIKV replicon-induced VPs in BHK-21 cells, which is the characteristic structure of replication compartments. Ve, vesicle. Scale bar, 200 nm. (C and D) ER morphology of APEX2-NS2A-4B–expressed cells. The polyprotein containing ZIKV NS2A, 2B, 3, 4A, and 4B was expressed in HeLa cells, and ER morphology was examined by confocal microscope (C) or EM (D). Scale bars in D, 1 µm (left panel), 500 nm (right panel). (E) ZIKV replicon luciferase assay. Renilla luciferase activity was measured at 10 h and 36 h after transfection of cells with WT or mutated ZIKV replicon RNA. (F) dsRNA intermediate detection in replicon transfected cells. WT or ΔNS1 replicon-transfected BHK-21 cells were stained with J2 antibody (green, anti-dsRNA antibody) and anti-PDI antibody (red, ER marker). (G and H) NS1 is enriched at the site of ER aggregation in ZIKV-infected HeLa cells. ZIKV-infected HeLa cells were stained with antibodies specific for ZIKV NS1 (green) and calreticulin (red). The percentage was defined as the ratio of the number of cells with NS1 enrichment at ER aggregation sites to the number of NS1-positive cells. (I and J) Expression of ZIKV NS1 in ER lumen induces ER remodeling. Myc-tagged cytosolic ZIKV NS1 (without signal sequence, −ss) and ER lumen-located NS1 (led by signal sequence, +ss) were stained with anti-Myc (green) and calreticulin (red) antibodies. A higher-magnification image is shown below. The arrows indicate ER aggregation in cells expressing high NS1 levels. The arrowheads indicate ER morphology in cells expressing less NS1. The percentage was defined as the ratio of the number of cells with ER remodeling to the number of NS1-expressing cells. Scale bars, 20 µm for the confocal images in A, C, F, G, and I. The data are presented as the mean ± SEM. The P values are obtained from a two-tailed t test. ***, P < 0.001.

