Figure 2.
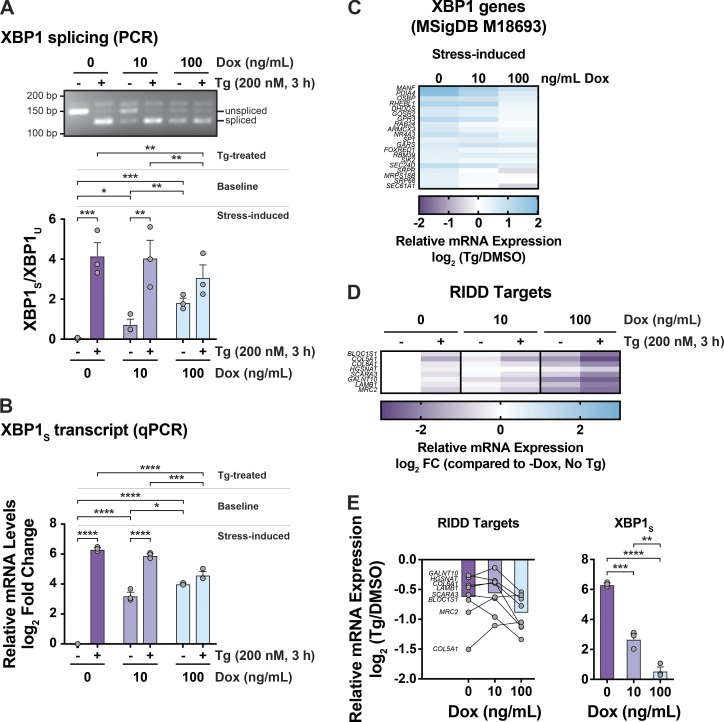
IRE1β suppresses IRE1α–XBP1 signaling. (A and B) XBP1 splicing was assayed by (A) PCR and gel electrophoresis to detect spliced and unspliced XBP1 or (B) qPCR to detect spliced XBP1 transcript in HEK293doxIRE1β cells treated with Dox and Tg as indicated (n = 3). (C) Same as in A, with differential expression of XBP1 genes assayed by RNA-seq. Data are shown for stress-induced expression (Tg compared with DMSO, left panel) for all genes in signature that are differentially expressed for control cells (No Dox, n = 3). (D) Same as in C for indicated RIDD targets relative to control cells (No Dox) without stress treatment (No Tg). (E) Left: Stress-induced changes in expression of RIDD targets for cells treated with indicated concentrations of Dox. Bars represent the average fold change for all targets. The symbols represent the mean fold change for an individual target gene. Right: Stress-induced fold change in spliced XBP1 transcript replotted from qPCR data in B. Bars and error bars represent mean values ± SEM; significance is indicated by asterisks (*, P < 0.05; **, P < 0.01; ***, P < 0.001; ****, P < 0.0001).

