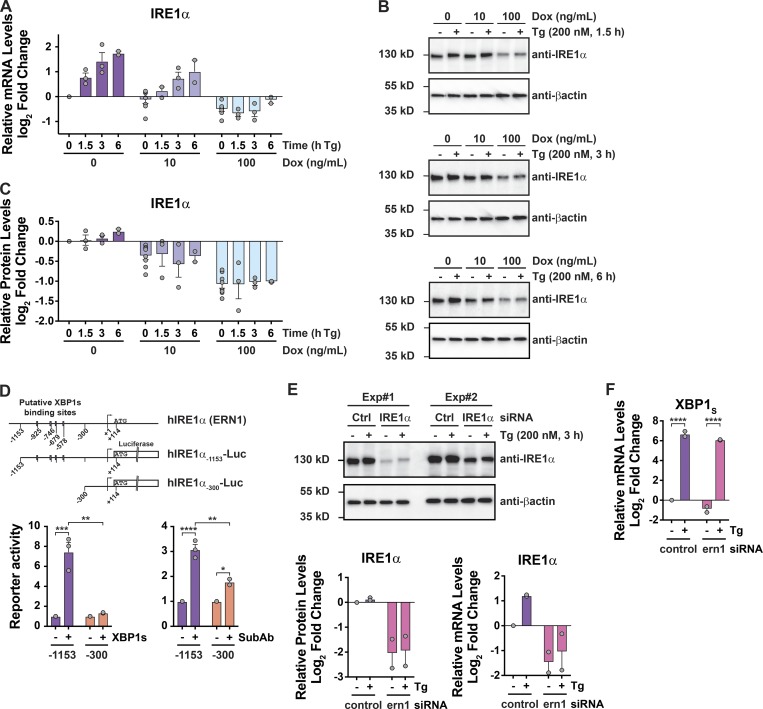
Figure 3.
Suppression of IRE1α expression does not explain how IRE1β affects the UPR. (A–C) IRE1α expression was assayed by (A) qPCR for mRNA or (B) immunoblot for protein in HEK293doxIRE1β cells treated with Tg for indicated time points (immunoblots are representative of two or three independent experiments). The anti-βactin blot for the 3-h Tg treatment (fourth row down) is duplicated from Fig. 1 C, as the same experiment and membrane was used to probe for anti-FLAG (Fig. 1 C), anti-IRE1α, and anti-βactin. The actin normalized band intensities are plotted in C. For A and C, data are plotted as log2 fold change relative to 0 ng/ml Dox without Tg. Each experiment for a given time point included a control sample without Tg. (D) Top: Schematic of human IRE1α gene (ERN1) promoter region and luciferase reporter constructs. Putative XBP1 binding sites are indicated as boxes. (Bottom panel) IRE1α-Luc reporter activity in HEK293T cells (left) cotransfected with either control vector or XBP1 expression vector or (right) treated with SubAA272B or SubAB (100 ng/ml) for 8 h (n = 3). (E) IRE1α protein and mRNA levels in HEK293doxIRE1β cells transfected with IRE1α siRNA or control siRNA and treated with Tg (n = 2). (F) Same as in E for spliced XBP1 mRNA. Bars and error bars represent mean values ± SEM; significance is indicated by asterisks (*, P < 0.05; **, P < 0.01; ***, P < 0.001; ****, P < 0.0001).

