Figure 5.
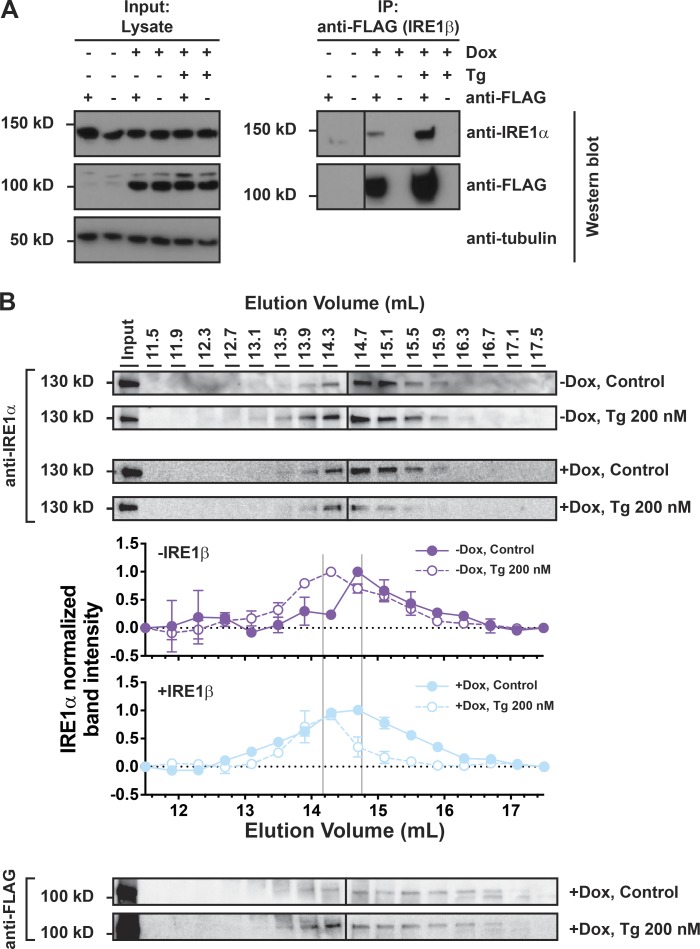
IRE1β interacts with IRE1α. (A) IRE1α and IRE1β proteins were assayed by immunoblot with anti-IRE1α or anti-FLAG antibodies, respectively, for lysates or samples immunoprecipitated with anti-FLAG from HEK293doxIRE1β cells treated with Dox and Tg as indicated. Blots are representative of three independent experiments. (B) Oligomerization of endogenous IRE1α was assayed by gel filtration fractionation of lysates from HEK293doxIRE1β cells and immunoblot with anti-IRE1α antibody. Fraction band intensities are plotted relative to the band intensity for the input sample, which was included on each gel, and normalized to fractions with the highest relative intensity (assigned a value of 1) and lowest relative intensity (assigned a value of 0). Symbols represent mean ± range for two independent experiments.

