Figure 1.
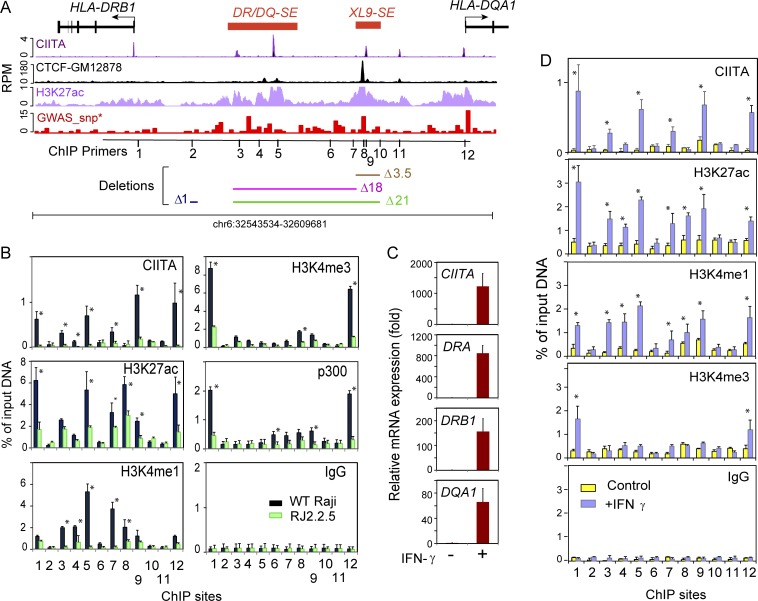
Two SEs reside in the intergenic region between HLA-DRB1 and HLA-DQA1. (A) Schematic of the HLA-DR, -DQ intergenic region. CIITA, CTCF, and H3K27ac ChIP-seq data from The ENCODE Project Consortium (2012) and Scharer et al. (2015) are plotted with respect to the HLA-DRB1 and HLA-DQA1 genes. Red bars represent the DR/DQ-SE and XL9-SE SEs. The GWAS-SNP track shows the density of disease-associated SNPs in 500-bp bins across the region. The positions of ChIP primers (Table S1) are shown, as are regions that are deleted in the CRISPR/Cas9 mutant series. (B) Conventional ChIP-qPCR was performed on Raji and RJ2.2.5 cell chromatin for the indicated antibody with ChIP primer sets located at positions illustrated in A. (C) Relative fold change of the indicated gene expression as determined by qRT-PCR of A-431 cells ± 24 h treatment with IFNγ. (D) ChIP as in B of A-431 cells ± IFNγ treatment. Experiments in this figure were performed at least three times from independent cultures. Data represent mean ± SD, and significance was determined by Student’s t tests. *, P ≤ 0.05.

