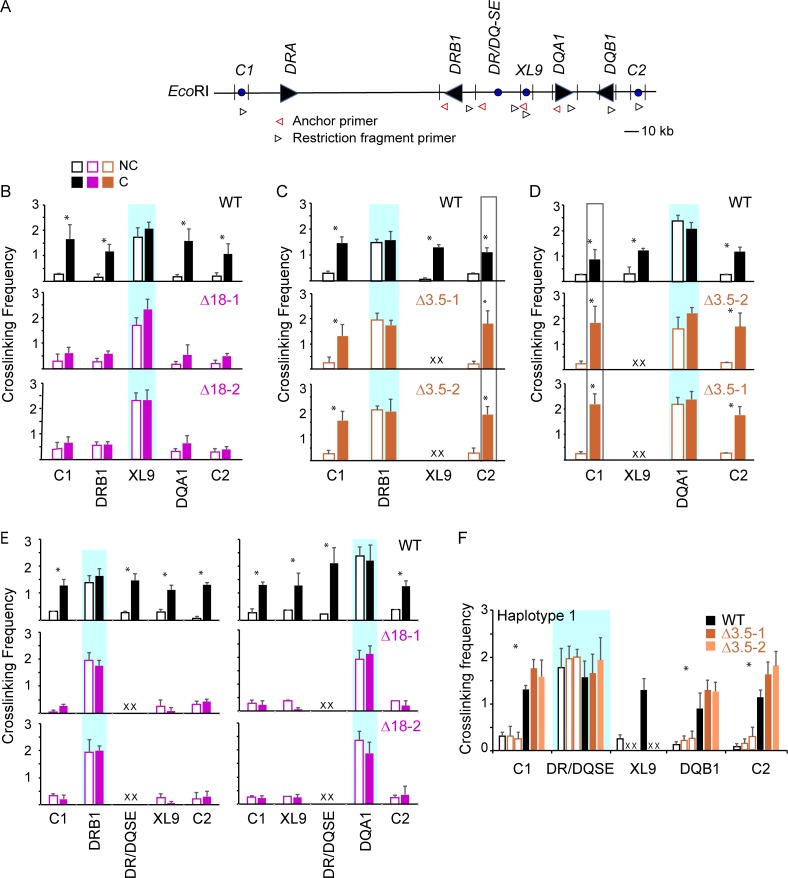
Figure 7.
The DR/DQ-SE controls CTCF-CTCF site as well as CTCF site–promoter interactions within the DR-DQ MHC II region. (A) Schematic map of HLA-DR and HLA-DQ regions, including CTCF sites C1, XL9, and C2. The locations of the 3C primers (black arrowheads) and anchors (red arrowheads) used in these assays are indicated. (B–F) Quantitative 3C was performed as in Fig. 6 to assess interactions between XL9, DR/DQ-SE, HLA-DRB1, -DQA1 promoters or CTCF sites C1 and C2 in Raji cells (WT) or the indicated mutant isolate. Blue shaded boxes indicate the anchor region. C, cross-linked (solid bars); NC, non–cross-linked samples (open bars). Data were derived from three independent chromatin preparations. SDs are shown, and two-tailed Student’s t tests were performed between C and NC samples. *, P ≤ 0.05.

