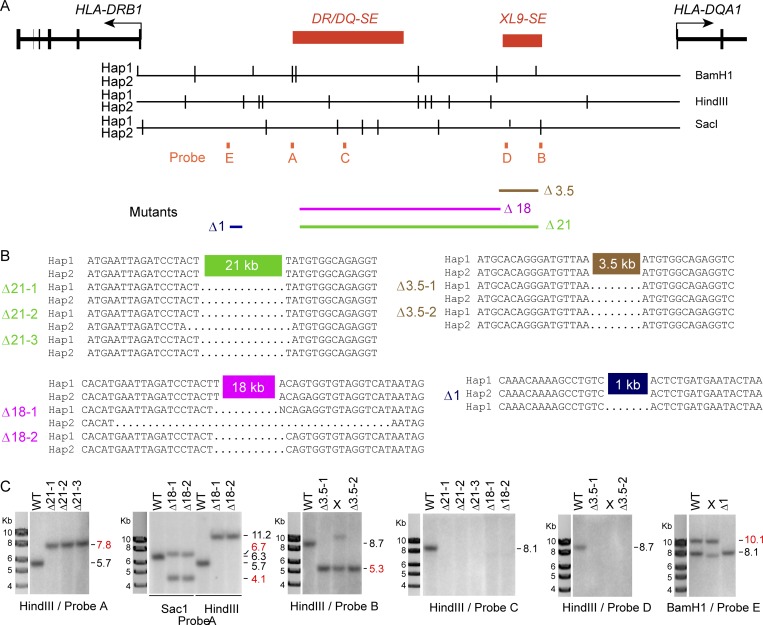
Figure S2.
Genomic analysis of CRISPR/Cas9 gene-edited clonal isolates. (A) Schematic of restriction enzyme sites relative to the DR-DQ intergenic region. For each of the Raji haplotypes (Hap1/Hap2), the vertical bars indicate the relative location of the restriction sites in the region that were used for Southern blotting. The positions of the Southern blot probes and relative locations of the deletions are indicated below map. (B) DNA sequences of the novel junctions formed by CRISPR/Cas9 editing are shown. Dots indicate region not present. Haplotypes were determined by polymorphisms in adjacent sequences not shown. (C) Southern blots of the indicated mutant isolates with the restriction enzyme and probe used in each. Red molecular weight positions (kb) indicate the positions of expected mutant bands. Lanes denoted with an X represent clones not used due to an incorrect banding pattern.

