Figure 6.
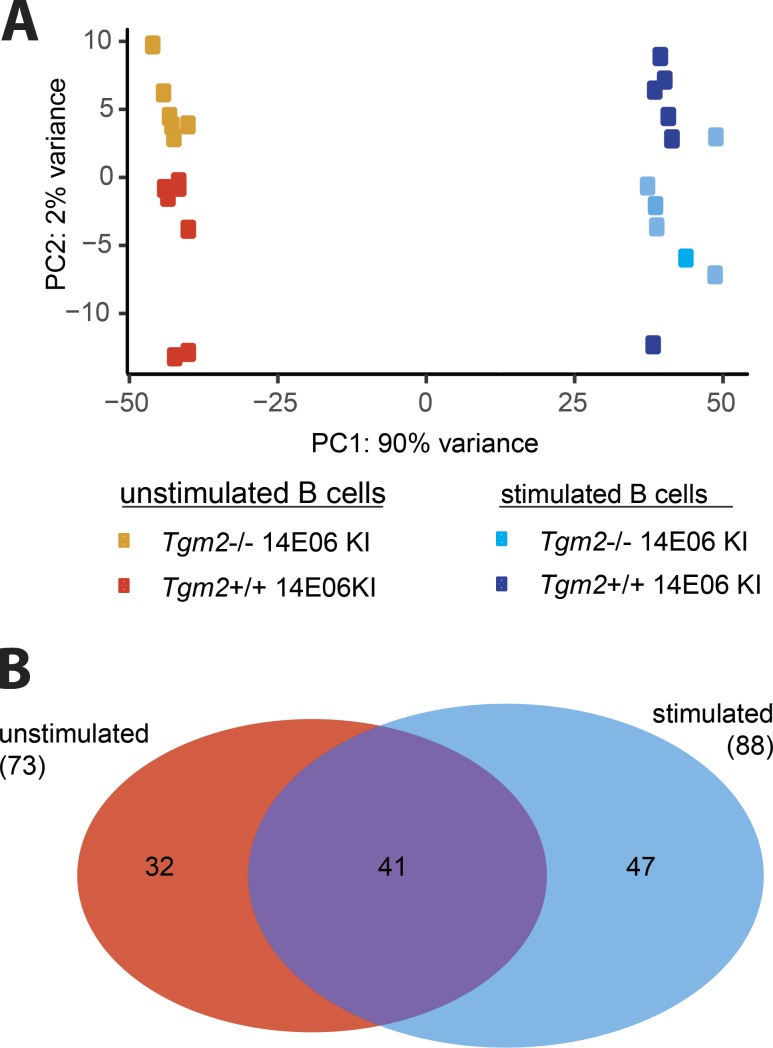
Transcriptome analysis of 14E06 KI B cells. (A and B) B cells were isolated from spleens of Tgm2+/+ and Tgm2−/− 14E06 KI mice for RNA-seq profiling before and after stimulation with 2 µg/ml TG2 for 120 min (n = 6 mice per group in a single experiment). (A) Principal component analysis (PCA). (B) Venn diagram showing differentially expressed genes between unstimulated and stimulated B cells for Tgm2+/+ vs. Tgm2−/− 14E06 KI mice.

