Figure 1.
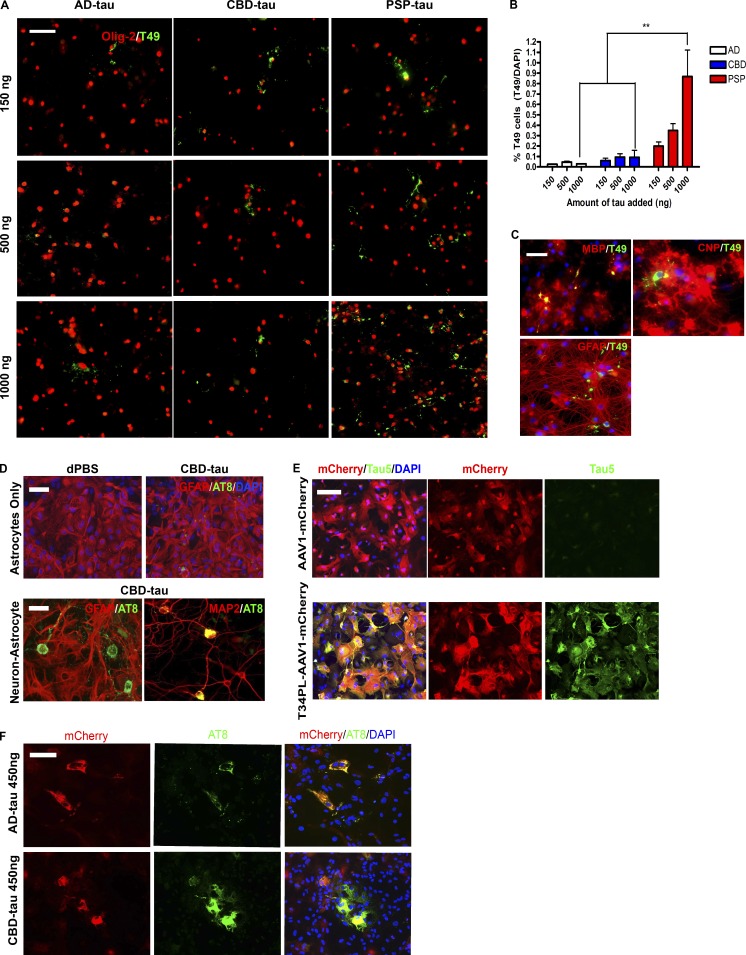
Seeding of cultured oligodendrocytes and astrocytes with tau strains. (A) ICC for Olig-2 (red) and T49 (green) after seeding of oligodendrocyte cultures with AD-tau (n = 3 cases), CBD-tau (n = 3 cases), and PSP-tau (n = 1 case). Four independent experiments. Scale bar, 50 µm. (B) Quantification of T49+ cells from A. Mean ± SEM plotted. Two-way ANOVA with Bonferroni post hoc test. P = 0.0246 (**, P < 0.01). (C) ICC for MBP (red), CNP (red), GFAP (red), and T49 (green) after seeding with PSP-tau (500 ng/coverslip). Two independent experiments. Scale bar, 50 µm. (D) Top: ICC for GFAP (red) and AT8 (green) of astrocyte cultures seeded with CBD-tau (450 ng/coverslip). Bottom: ICC for GFAP (red, astrocyte) and AT8 (green; left) and MAP2 (red, neuron) and AT8 (green; right) of neuron–astrocyte co-cultures seeded with CBD-tau (450 ng/coverslip). Dulbecco's PBS (dPBS) used as control. Two independent experiments. Scale bars, 50 µm. (E) ICC for Tau5 (green) and mCherry (red) post-viral transfection of T34PL-AAV1-mCherry or AAV1-mCherry in astrocyte cultures. Two independent experiments. Scale bar, 50 µm. (F) ICC for AT8 (green) and mCherry (red) in virally transfected astrocytes seeded with AD-tau (n = 3 cases) or CBD-tau (n = 3 cases) at 450 ng/coverslip. Two independent experiments. Scale bar, 50 µm.

