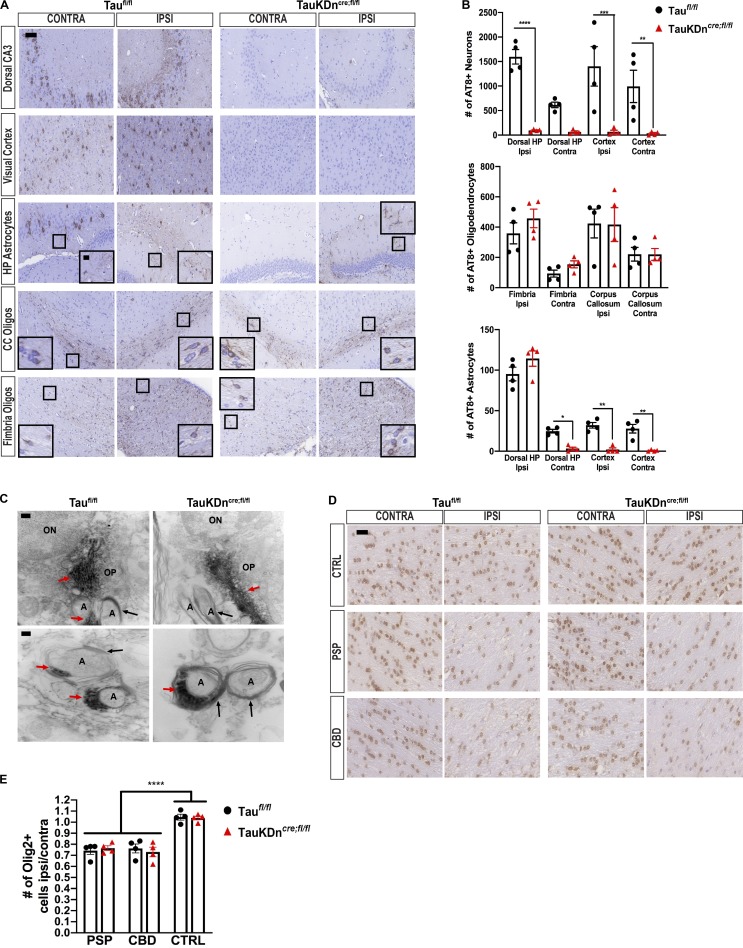
Figure 5.
Oligodendroglial tau pathology propagation in TauKDncre;fl/fl mice. (A) AT8 IHC on PSP-tau–injected TauKDncre;fl/fl and Taufl/fl mice (n = 4 each) 6 mo p.i. Two independent experiments. CC, corpus callosum. Scale bars, 50 µm; inset, 10 µm. (B) Quantification of AT8+ neurons, oligodendrocytes, and astrocytes from A. Mean ± SEM plotted. One-way ANOVA for neurons, P = 0.0001; oligodendrocytes, P = 0.0029; astrocytes, P = 0.0001; post hoc analysis: *, P < 0.05, **, P < 0.01, ***, P < 0.001, ****, P < 0.0001. (C) Immuno-EM of AT8 in corpus callosum of CBD-tau–injected Taufl/fl and TauKDncre;fl/fl mice (n = 3 each) 3 mo p.i. Two independent experiments. ON, oligodendrocyte nucleus; OP, oligodendrocyte process; A, axon; red arrows, tau fibril; black arrows, myelin sheath. Scale bars, top, 200 nm; bottom, 100 nm. (D) Olig-2 IHC in the fimbria of CBD-tau, PSP-tau, and control-brain–injected TauKDncre;fl/fl and Taufl/fl mice (n = 4 mice each) 3 mo p.i. Two independent experiments. Scale bar, 25 µm. (E) Quantification of Olig-2+ cells from C. Mean ± SEM plotted. One-way ANOVA with Bonferroni post hoc P < 0.0001; post hoc: *, P < 0.05, **, P < 0.01, ***, P < 0.001.

