Figure 2.
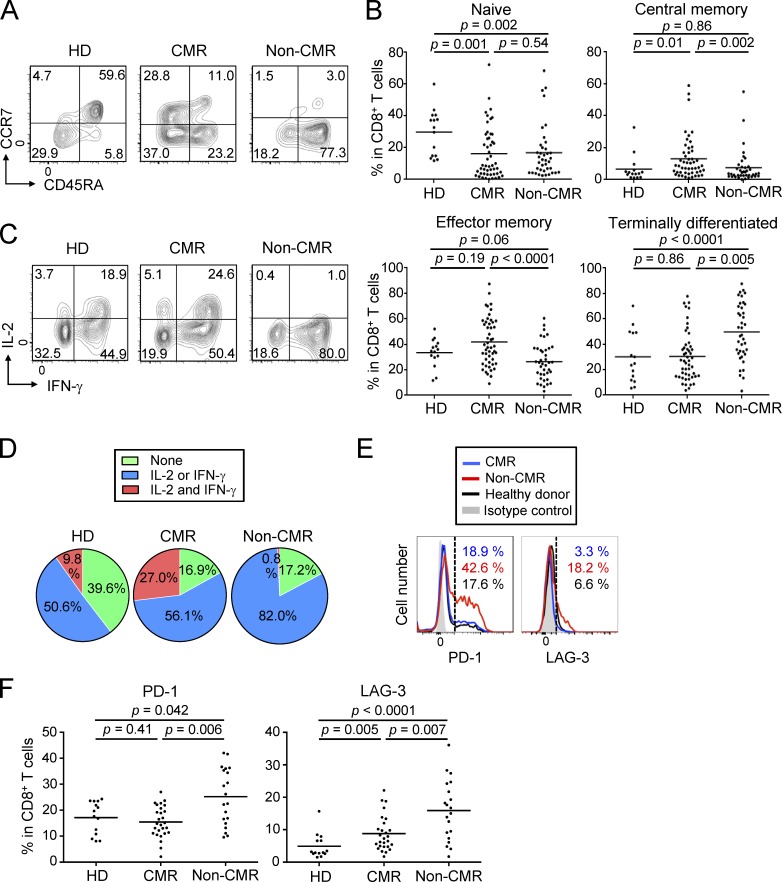
General activation of CD8+ T cells under chronic imatinib treatment. (A) Representative staining for CD45RA and CCR7 to assess naive, central memory, effector memory, and terminally differentiated CD8+ T cells in PBMCs from a healthy donor (HD) and CML patients in CMR or non-CMR. (B) Frequencies of each subset among CD8+ T cells from PBMCs of healthy donors (n = 15) and CML patients in CMR (n = 51) or non-CMR (n = 42). Data are pooled from more than two independent experiments. (C and D) IFN-γ and IL-2 production by CD8+ T cells stimulated with PMA and ionomycin. Representative staining of intracellular cytokines (C) and percentages (D) of cytokine-producing cells in CD8+ T cells from healthy donors (n = 15) and CML patients in CMR (n = 23) or non-CMR (n = 20). Data are pooled from more than two independent experiments. (E and F) Expression of cell surface markers for T cell exhaustion. (E) Representative PD-1 and LAG-3 staining of CD8+ T cells in the blood from a healthy donor and CML patients in CMR or non-CMR. (F) Frequencies of PD-1–positive and LAG-3–positive CD8+ T cells from PBMCs of healthy donors (n = 14) and CML patients in CMR (n = 28) or non-CMR (n = 21). Horizontal lines in B and F indicate medians. Analyses in C–F were performed in patients from whom sufficient numbers of PBMCs were available. Statistical significance was assessed by Mann-Whitney U test in B and F.

