Figure 3.
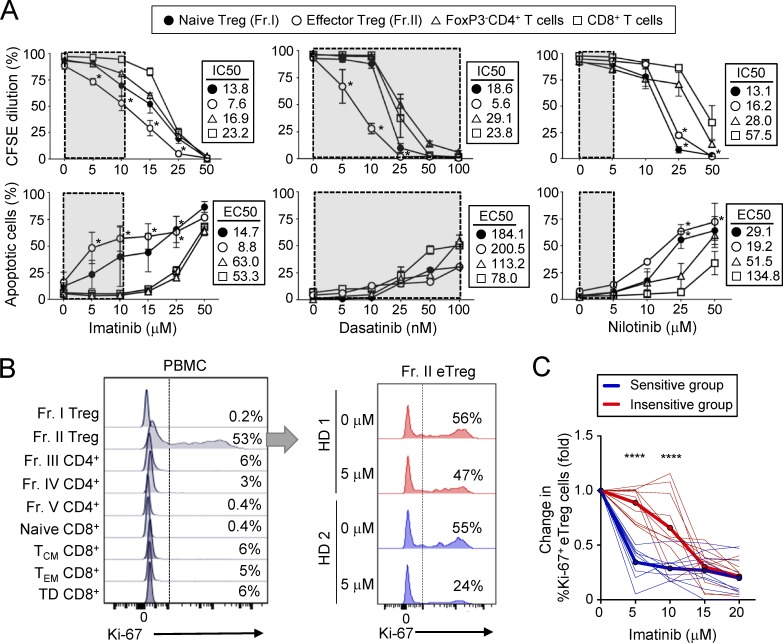
Imatinib selectively reduces eT reg cells in vitro. (A) Proliferation inhibition and apoptosis induction by imatinib, dasatinib, and nilotinib. Subsets of CD4+ T cells (Fr. I and II and FoxP3− T cells) and CD8+ T cells prepared from PBMCs of healthy donors were stimulated with anti-CD3 and anti-CD28 mAbs with graded doses of imatinib (n = 8), dasatinib (n = 5), or nilotinib (n = 5) for 5 d. Proliferation was assessed by CFSE dilution and apoptosis by Annexin V and 7-AAD staining. Half-maximal inhibitory concentration (IC50) for proliferation and half-maximal effective concentration (EC50) for apoptosis are shown. Gray boxes indicate therapeutic doses. Data are pooled from more than two independent experiments. (B and C) Ki-67 staining of indicated subsets in freshly obtained PBMCs of a healthy individual (B, left; representative of five samples) and Ki-67 staining of Fr. II eT reg cells cultured with or without imatinib and 5 U/ml IL-2 for 5 d (B, right; two typical staining patterns representative of 10 samples in C). TCM, central memory T; TEM, effector memory T; TD, terminally differentiated. Percentages of Ki-67+ cells are indicated. Fold differences (C) in Ki-67+ eT reg frequencies after the culture in B. Donor samples (thin lines) were clustered by hierarchical clustering and K-means clustering into two groups. An insensitive group (red) with higher cluster means (bold red) and sensitive group (blue) with lower cluster means (bold blue) at 5 and 10 µM imatinib doses (n = 20). Data are pooled from more than two independent experiments. Error bars indicate means ± SEM in A. Statistical significance was assessed by two-way ANOVA with Holm-Sidak multiple comparisons to CD8+ T cells in A, and between two clustered groups at each dose in C. *, P < 0.05; ****, P < 0.0001.

