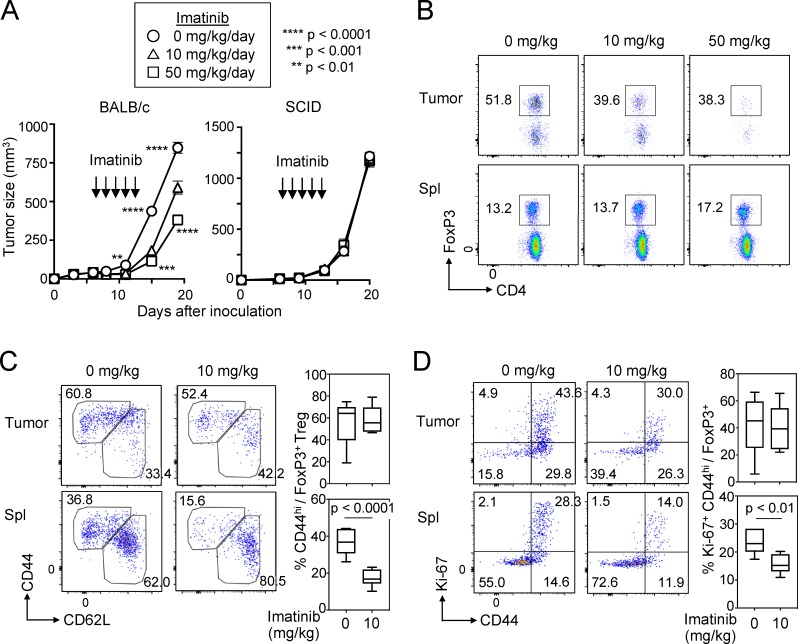
Figure 5.
Imatinib-induced T reg cell reduction hinders growth of inoculated tumor in mice. (A) Tumor growth curve of BALB/c or BALB/c SCID mice inoculated with CT26 colon cancer. Mice were treated with imatinib at indicated doses for 5 d (n = 9 or 10 BALB/c or n = 8 or 9 SCID mice per each treatment group/experiment). Representative of two independent experiments. Tumor curves were assessed by two-way ANOVA, and asterisks by circles or squares indicate statistical significance between 0 and 10 mg/kg/d treated groups or 0 and 50 mg/kg/d treated groups for each time point, respectively. (B) The frequency of splenic (Spl) and tumor-infiltrating Foxp3+ T reg cells on the third day of imatinib treatment (10 d after tumor inoculation) as in A. Representative staining of each group (n = 3 or 4 mice per group). (C and D) Representative staining of Foxp3+CD4+ T cells in the tumor or the spleen for CD44 and CD62L (C, left) and the frequency of CD44hiCD62Llo FoxP3+ effector T reg cells in the tumor (C, right top) or the spleen (C, right bottom) 3 d after the last imatinib treatment (15 d after tumor inoculation). Representative staining of Foxp3+CD4+ T cells in the tumor or the spleen for CD44 and Ki-67 (D, left) and the frequency of Ki-67+CD44hi FoxP3+ T reg cells in the tumor (D, right top) or the spleen (D, right bottom) of the mice (n = 6 or 8 mice per group in two independent experiments). Error bars indicate means ± SEM in A or means ± SD in C and D. Statistical significance was assessed by two-way repeated-measure ANOVA with Tukey’s multiple comparisons test in A, or by two-sided Student’s t test in C and D.

