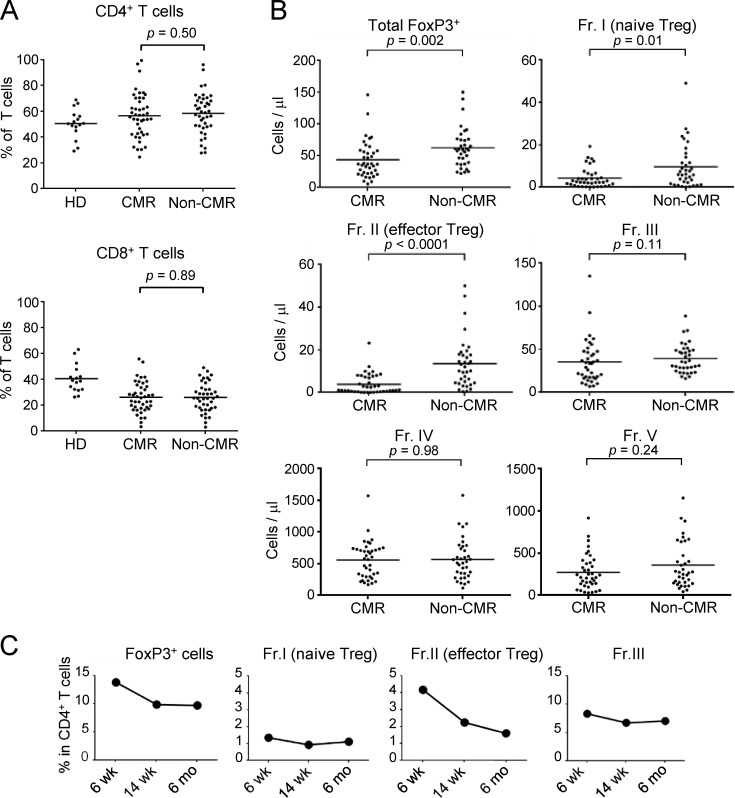
Figure S1.
Reduction of T reg cells, especially eT reg cells, by chronic imatinib treatment. (A) Frequencies of total CD4+ and CD8+ T cells in PBMCs of healthy donors (HD; n = 15) and CML patients in CMR (n = 51) or non-CMR (n = 42) as in Fig. 1 B. (B) The numbers of total FoxP3+ T cells and each subset (Fr. I, II, III, IV, and V) among CD4+ T cells from PBMCs of CML patients in CMR (n = 51) or non-CMR (n = 42) as in Fig. 1 B. (C) Kinetics of the frequencies of total FoxP3+ T cells and each subset (Fr. I, II, and III) among CD4+ T cells in a CML patient from whom sufficient amounts of PBMCs during clinical course were obtained. Data are pooled from at least two independent experiments. Horizontal lines indicate medians. Statistical significance was assessed by Mann–Whitney U test.

