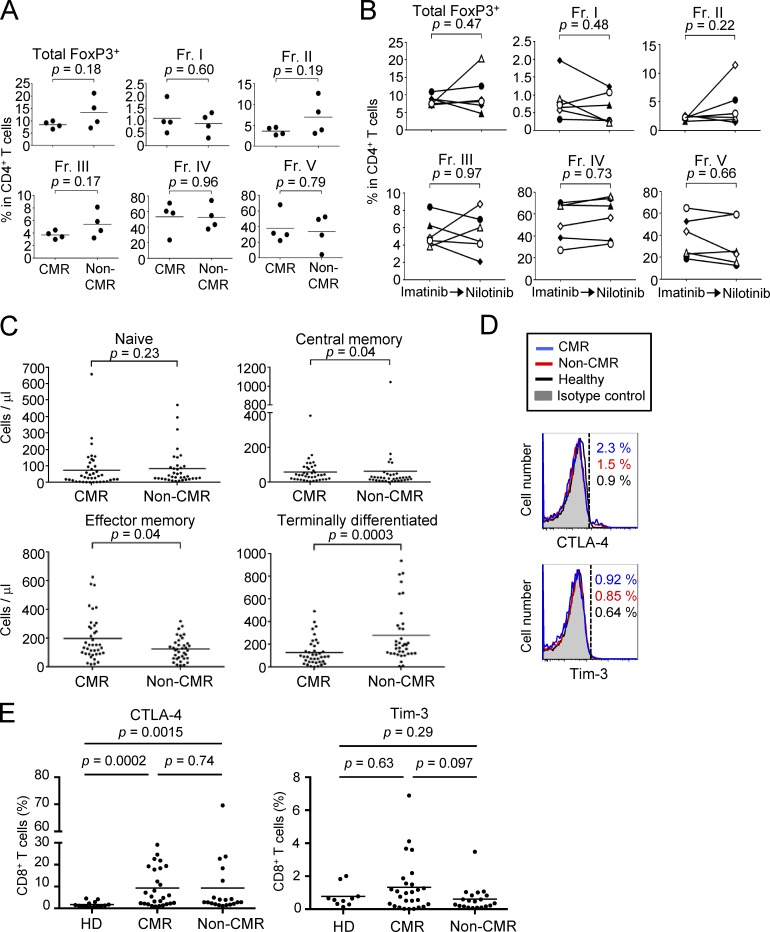
Figure S2.
Frequencies of T reg cells and CD8+ T cell subsets under imatinib treatment, nilotinib treatment, or after switching to nilotinib from imatinib. (A and B) Frequencies of total FoxP3+ T cells and each subset (Fr. I, II, III, IV, and V) among CD4+ T cells from PBMCs of CML patients in CMR or non-CMR after nilotinib treatment (A, n = 4) or of CML patients who achieved CMR after switching from imatinib to nilotinib (B, n = 5). (C) The numbers of naive, central/memory, effector/memory, and terminally differentiated CD8+ T cells in the blood from CML patients in CMR (n = 51) or non-CMR (n = 42) as in Fig. 2 B. (D and E) CTLA-4 and TIM-3 expressions by CD8+ T cells (D) and the frequency of CTLA-4–positive or Tim-3–positive cells (E) in PBMCs of healthy donors (HD; n = 14 or 10) and CML patients in CMR (n = 27) or non-CMR (n = 20). Analyses in E were performed in patients from whom sufficient numbers of PBMCs were available. Data are pooled from at least two independent experiments. Horizontal lines in A, C, and E indicate medians. Statistical significance was assessed by Mann–Whitney U test.

