Figure S4.
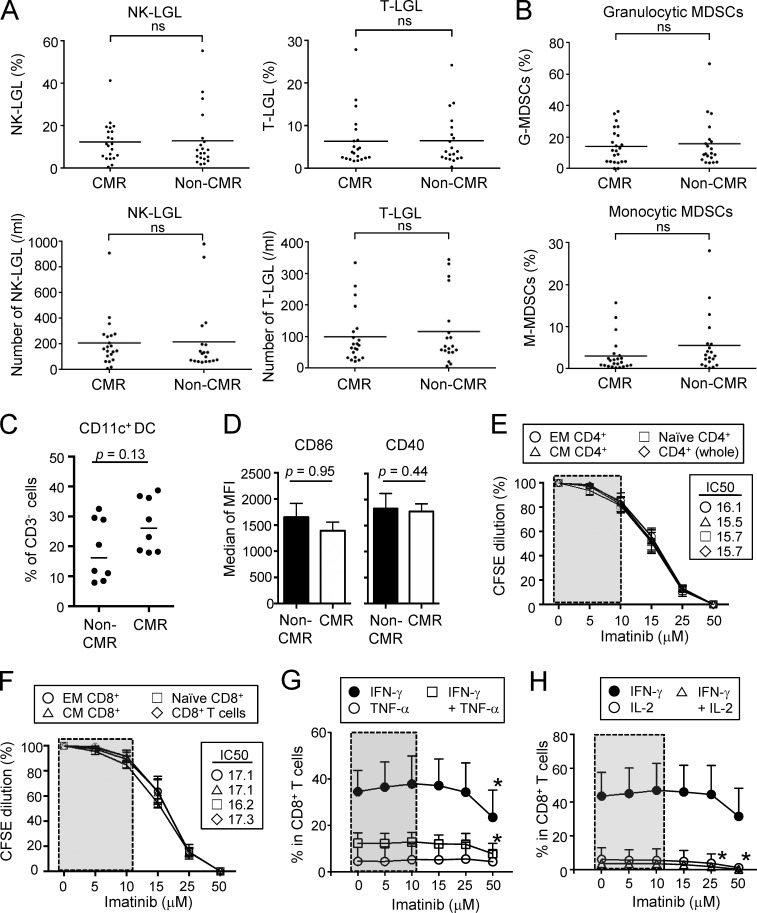
Effects of imatinib on LGLs, MDSCs, and proliferations of naive and effector CD4+ and CD8+ T cells. (A) The frequencies (top) and the numbers (bottom) of NK (CD3−CD16+CD56dimCD57+) and T (CD3+CD8+CD57+)-LGLs in the blood from CML patients in CMR (n = 21) or non-CMR (n = 20). (B) Frequency of granulocytic MDSCs (CD15+CD33+CD11b+HLA-DR−) and monocytic MDSCs (CD14+HLA-DR−) in the blood from CML patients in CMR (n = 23) or non-CMR (n = 20). (C) Frequency of CD11c+ MHC class IIhigh dendritic cells among CD3− cells from PBMCs of CML patients in CMR or non-CMR (n = 8 each). (D) Expressions of CD86 and CD40 by dendritic cells from PBMCs of CML patients in CMR or non-CMR (n = 8 each). Analyses were performed in patients from whom sufficient numbers of PBMCs were available. MFI, mean fluorescence intensity. (E and F) Proliferations of naive and effector subsets of CD4+ (E) and CD8+ (F) T cells prepared from PBMCs of healthy donors. Cells were stimulated with anti-CD3 and anti-CD28 mAbs with graded doses of imatinib (n = 5 each) for 5 d and assessed by CFSE dilution. CCR7+CD45RA+ as naive, CCR7+CD45RA− as central memory (CM), and CCR7−CD45RA− as effector memory (EM) T cells. (G and H) Effects of imatinib on cytokine production. CD8+ T cells from PBMCs of healthy donors (n = 6) were stimulated with PMA and ionomycin with graded doses of imatinib, and cytokine production was assessed by intracellular cytokine staining; IFN-γ and/or TNFα (G), and IFN-γ and/or IL-2 (H). Data are pooled from at least two independent experiments. Horizontal lines indicate medians in A–C. Statistical significance was assessed by Mann-Whitney U test in A–D or by two-way ANOVA with Holm-Sidak multiple comparisons to CD4+ T cells in E, CD8+ T cells in F, or each cytokine at 0 µM imatinib dose in G and H. Error bars indicate means ± SEM in D–H. ns, not significant; *, P < 0.05.

