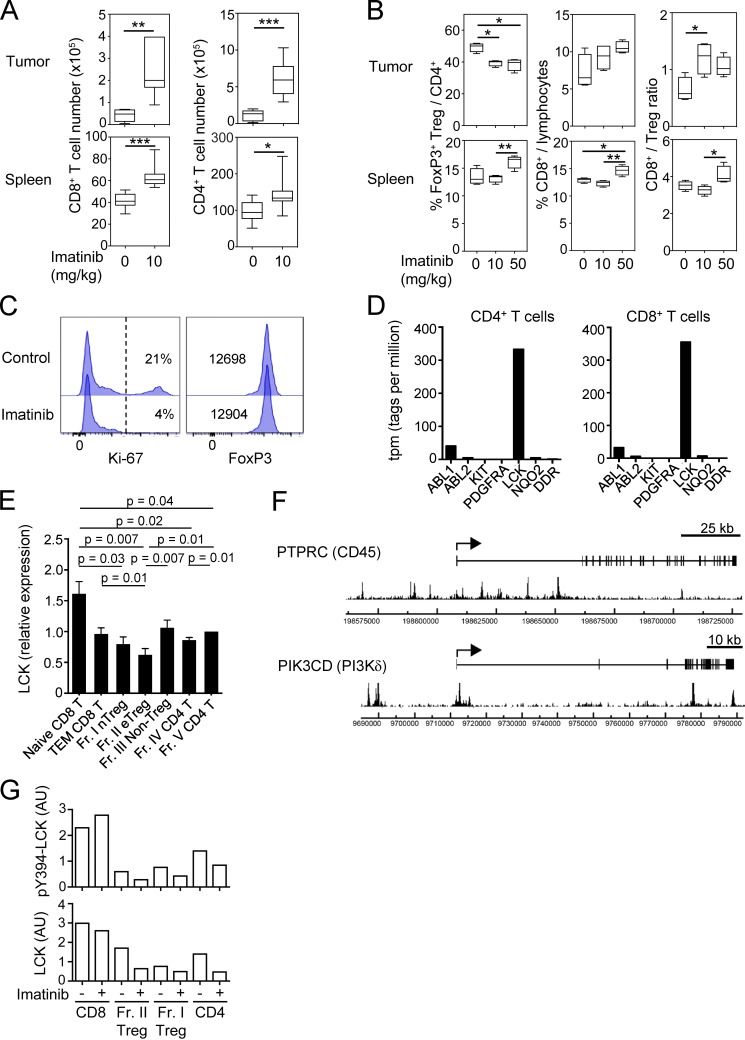
Figure S5.
Antitumor effect by imatinib in mice and molecular targets of imatinib in humans. (A) Total cell numbers of CD8+ and CD4+ T cells in the tumor (top) or the spleen (bottom) of CT26-inoculated BALB/c mice 3 d after the last imatinib treatment (15 d after tumor inoculation) as in Fig. 5 A. (B) The frequency and ratio of T reg cells and CD8+ T cells in Fig. 5 B. (C) Representative staining of Ki-67 and Foxp3 for CellTrace Violet+ T reg cells cultured with or without 10 µM imatinib and 5 U/ml IL-2 for 4 d. CD4+ Foxp3+ (GFP+) T reg cells from Foxp3-IRES-GFP reporter mice were sorted and labeled with CellTrace Violet before the culture (n = 3). Percentages of Ki-67+ cells (left) or mean fluorescence intensity of Foxp3 (right) are indicated in the plots. (D) Gene expression levels of putative targets of imatinib, including ABL1, ABL2, KIT, PDGFRA, LCK, NQO2,and DDR1 in human CD4+ or CD8+ T cells by deepCAGE (Cap Analysis of Gene Expression) database (CNhs 13223 and CNhs 12201). (E) LCK mRNA expressions in naive and effector subsets of CD8+ T, CD4+ T, and T reg cells prepared from PBMCs of healthy donors (n = 6). LCK mRNA levels relative to GAPDH were measured by quantitative real-time PCR. (F) FoxP3 binding near the promoter regions of human PIK3CD (gene encoding phosphatidylinositol-4,5-bisphosphate 3-kinase p110δ [PI3Kδ]) and PTPRC (gene encoding protein tyrosine phosphatase, receptor type C [CD45]) genes. The arrows indicate transcription start sites, boxes indicate exons, and peaks indicate FoxP3-binding sites from SRA data analysis (SRX060160; Birzele et al., 2011). (G) Signal intensities of pY394-LCK and total LCK protein with or without 10 µM imatinib in Fig. 6 C. AU, arbitrary unit. Error bars indicate means ± SD. Data are pooled from at least two independent experiments. Statistical significance was evaluated by two-sided Student’s t test. *, P < 0.05; **, P < 0.01; ***, P < 0.001.

