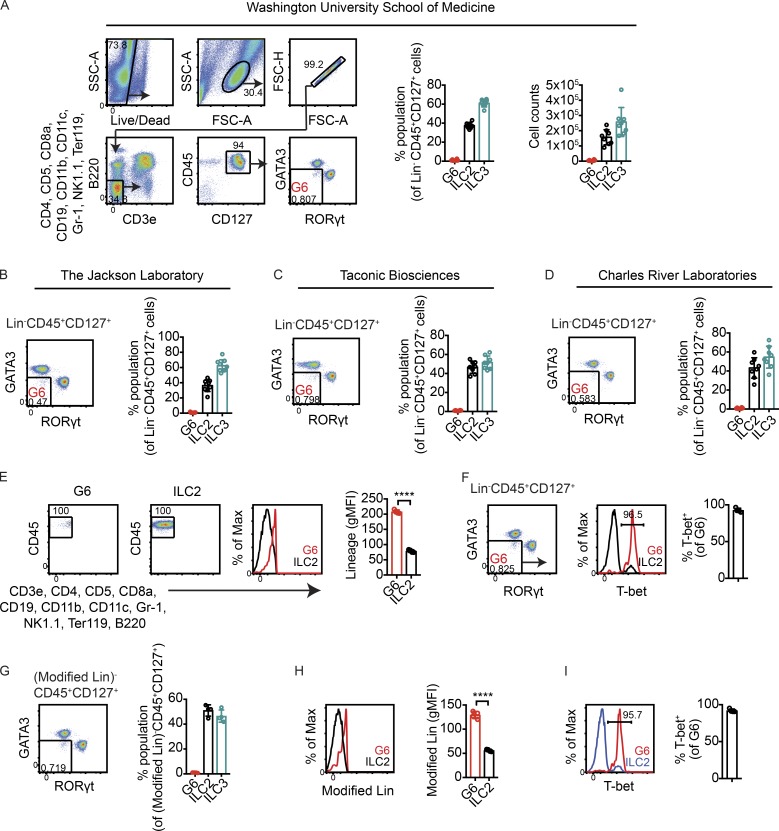
Figure 2.
No evidence for lineage-negative ILCs distinct from ILC2s and ILC3s in small intestines of mice bred at WUSM and mice purchased from commercial vendors. (A) Left: Gating strategy to identify lineage-negative events that lacked markers for ILC2s and ILC3s. Right: Frequencies and total numbers of Lin−CD45+CD127+ cells that were GATA3hi (ILC2s) or RORγt+ (ILC3s) or that lacked markers for both ILC2s and ILC3s (G6) in small intestine lamina propria of WT mice bred at WUSM (n = 8). (B–D) Frequencies of Lin−CD45+CD127+ cells that lacked ILC2 and ILC3 markers in mice purchased from JAX (n = 8; B), Taconic Biosciences (n = 8; C), and Charles River Laboratories (n = 8; D). (E) Representative flow cytometry plots showing backgated G6. ILC2s are shown as a reference for lineage-negative cells. Right, quantified gMFI of lineage staining in G6 and ILC2s (n = 4). (F) T-bet staining in G6 (n = 4). (G) Frequencies of G6, ILC2s, and ILC3s using a modified lineage staining panel (Modified Lin) in which anti-F4/80 antibodies were added while anti-B220 antibodies were excluded (n = 4). (H) gMFI of Modified Lin staining in G6 and ILC2s (n = 4). (I) Frequencies of T-bet+ cells within G6 obtained using Modified Lin staining (n = 4). Bars indicate means ± SD. Data were pooled from two independent experiments (A–D) or are representative of two independent experiments (D–I). ****, P < 0.0001.

