Figure 3.
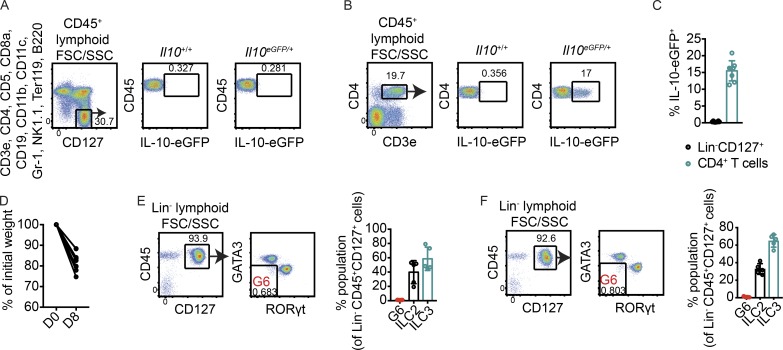
No evidence for ILCreg induction during intestinal inflammation. (A and B) Representative flow cytometry plots showing IL-10–eGFP expression in Lin−CD45+CD127+ cells (A) and CD4+ T cells (B) on day 8 of DSS treatment. (C) Frequencies of Lin−CD45+CD127+ cells and CD4+ T cells expressing eGFP in small intestine lamina propria in multiple mice (n = 8). (D) Body weight loss as a percentage of initial weight at day 8 of DSS treatment (n = 6). D0, day 0; D8, day 8. (E and F) Frequencies of Lin−CD45+CD127+ cells that lacked markers for both ILC2s and ILC3s in small intestine lamina propria of mice treated with DSS in drinking water for 8 d (n = 5; E) or in mice infected for 8 d with C. rodentium (n = 5; F). Frequencies of ILC2s and ILC3s are shown as controls. Bars indicate means ± SD. Data were pooled from two independent experiments (C) or are representative of two independent experiments (D–F).

