Figure 4.
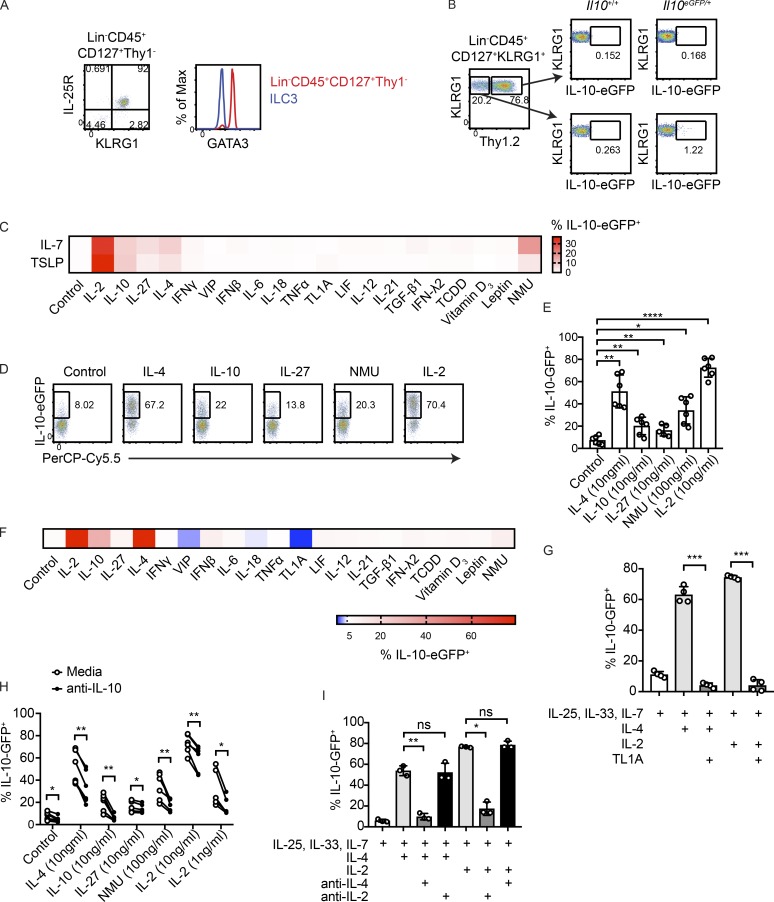
IL-10 production by intestinal ILC2s is induced by IL-2, IL-4, IL-10, IL-27, and NMU, and suppressed by TL1A. (A) Representative flow cytometry plots showing IL-25R, KLRG1, and GATA3 staining in Lin−CD45+CD127+Thy1− cells. (B) Representative flow cytometry plots showing expression of eGFP in Lin−CD45+CD127+KLRG1+ ILC2s that are Thy1+ and Thy1−. (C) Heatmap depicting frequencies of eGFP+ cells obtained by flow cytometric analysis of ILC2s cultured 2 d with IL-33, IL-25, and either IL-7 or TSLP, in combination with the indicated molecules. (D and E) Validation of results in C. Cells were cultured for 3 d with IL-33, IL-25, IL-7, and the indicated conditions (n = 5–6). (F) ILC2s cultured as in C using pre-activated ILC2s. (G) IL-4- or IL-2-elicited eGFP expression in ILC2s treated with TL1A (n = 4). (H and I) Isolated ILC2s were treated with IL-25, IL-33, IL-7, and the indicated molecules in the presence or absence of IL-10–blocking antibodies (n = 5–6; H) or in the presence or absence of IL-2- and IL-4–blocking antibodies (n = 3; I). Bars indicate means ± SD. Data from D, E, and H were analyzed from the same experiments. Data were pooled from two independent experiments (E and H) or are representative of two independent experiments (A, B, G, and I). *, P < 0.05; **, P < 0.01; ***, P < 0.001; ****, P < 0.0001.

