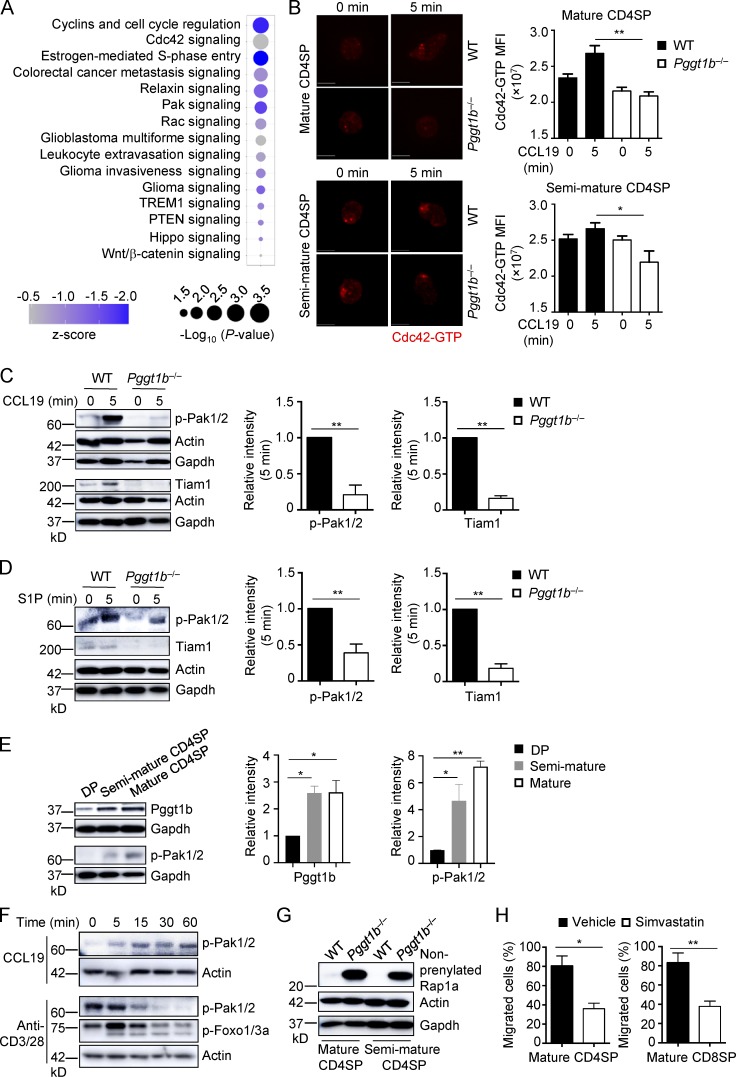
Figure 3.
Pggt1b integrates Cdc42, Pak signaling, and lipid metabolism in thymocyte trafficking, and its expression is up-regulated during thymocyte maturation. (A) Ingenuity Pathway Analysis of differentially expressed genes between WT and Pggt1b-deficient CD4SP cells identified in microarray assay. The top 15 down-regulated (z-score < 0) pathways are shown. (B) Representative immunofluorescent images (left) and MFI (right) of Cdc42-GTP expression in mature (top) and semimature (bottom) CD4SP thymocytes from WT and Pggt1b−/− mice after stimulation with CCL19 for 5 min. Scale bar, 5 μm. (C) Immunoblot analysis (left) and quantifications (right; after normalization to actin) of p-Pak1/2 and Tiam1 expression in mature CD4SP thymocytes from WT and Pggt1b−/− mice upon CCL19 stimulation. (D) Immunoblot analysis (left) and quantifications (right; after normalization to actin) of p-Pak1/2 and Tiam1 expression in mature CD4SP thymocytes from WT and Pggt1b−/− mice upon S1P stimulation. (E) Immunoblot analysis (left) and quantifications (right) of Pggt1b and p-Pak1/2 expression in different thymic T cell populations of WT mice. (F) Immunoblot analysis of p-Pak1/2 or p-Foxo1/3a expression in mature CD4SP thymocytes from WT mice upon CCL19 or anti-CD3/28 stimulation. (G) Immunoblot analysis of nonprenylated Rap1a expression in mature and semimature CD4SP thymocytes from WT and Pggt1b−/− mice. (H) Chemotactic response of mature CD4SP and CD8SP thymocytes from WT mice pretreated with simvastatin or vehicle for 5 d. Migration through 5-µm transwells in response to CCL19 was assessed by flow cytometry. Data are shown as mean ± SEM. *, P < 0.05; **, P < 0.01; one-way ANOVA in B and E and two-tailed unpaired Student’s t test in C, D, and H. Data are from two (B and E–H) or three (C and D) independent experiments.

