Figure S1.
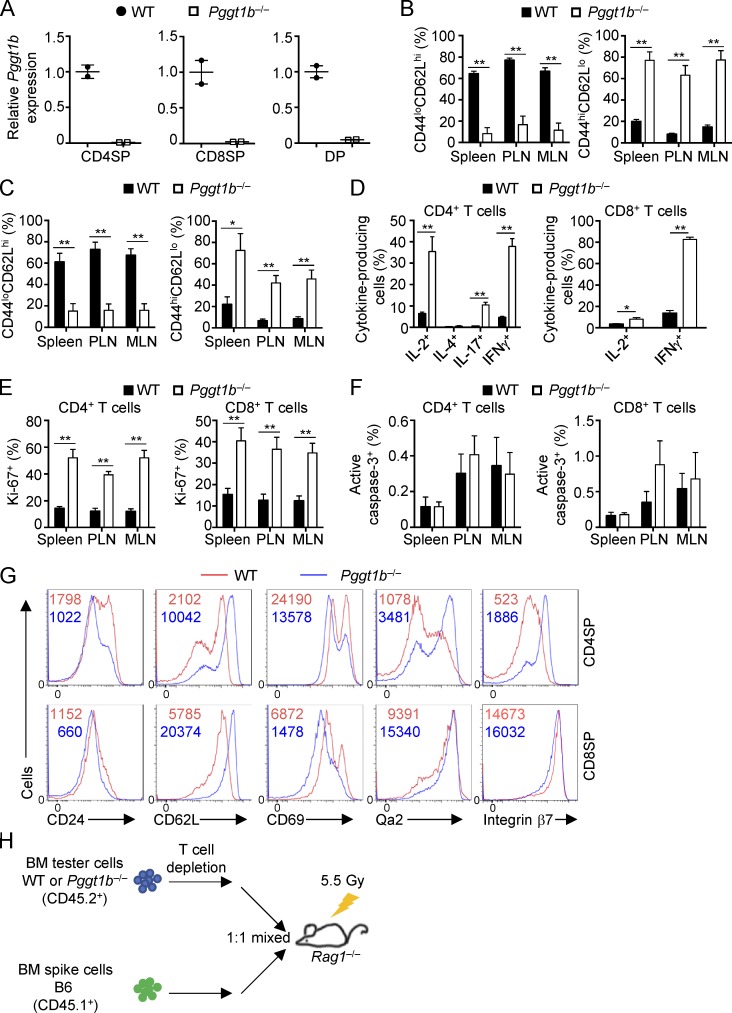
Pggt1b mRNA expression, peripheral immune homeostasis, and thymic maturation marker expression in WT and Pggt1b−/− mice. (A) Real-time PCR analyses of Pggt1b mRNA expression in CD4SP, CD8SP, and DP thymocytes from WT and Pggt1b−/− mice. (B and C) Frequencies of CD44loCD62Lhi naive and CD44hiCD62Llo effector/memory cells in CD4+ (B) or CD8+ (C) T cells from spleen, PLNs, and MLNs of WT and Pggt1b−/− mice. (D) Frequencies of cytokine-producing cells in splenic CD4+ (left) or CD8+ (right) T cells from WT and Pggt1b−/− mice. (E and F) Frequencies of Ki-67+ (E) and active caspase-3+ (F) cells in CD4+ (left) or CD8+ (right) T cells from WT and Pggt1b−/− mice. (G) Flow cytometry analysis of CD24, CD62L, CD69, Qa2, and integrin β7 expression on CD4SP and CD8SP cells from WT and Pggt1b−/− mice. (H) Strategy for generation of mixed BM chimeras. BM cells from CD45.2+ WT or Pggt1b−/− mice were mixed with BM cells from CD45.1+ mice at a 1:1 ratio and transferred into sublethally irradiated Rag1−/− mice. Numbers in graphs indicate MFI. Data are shown as mean ± SEM. *, P < 0.05; **, P < 0.01; two-tailed unpaired Student’s t test in B–E. Data are from four (B, C, E, and F) or three (D and G) independent experiments.

