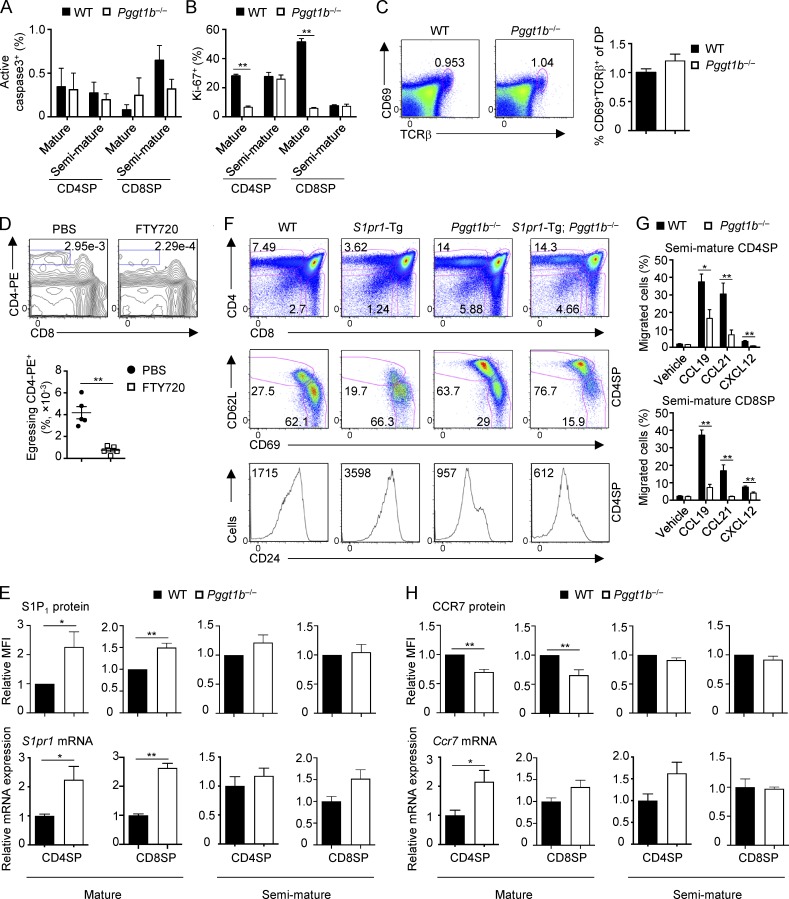
Figure S2.
Homeostasis and migration of WT and Pggt1b−/− thymocytes. (A and B) Frequencies of active caspase-3+ (A) and Ki-67+ (B) cells in mature and semimature CD4SP and CD8SP thymocytes from WT and Pggt1b−/− mice. (C) Flow cytometry analysis (left) and frequency (right) of thymic CD69+TCRβ+ DP cells in WT and Pggt1b−/− mice. (D) Flow cytometry analysis (upper) and statistics (lower) of egressing CD4SP thymocytes gated as CD4-PE+CD8− cells in WT mice treated with PBS or FTY720 (to inhibit egress) for 16 h. (E) Flow cytometry (top) and real-time PCR (bottom) analyses of S1P1 protein and S1pr1 mRNA expression in mature and semimature SP thymocytes from WT and Pggt1b−/− mice. (F) Flow cytometry analysis of total thymic T cells (top), mature and semimature CD4SP thymocytes (middle), and CD24 expression on CD4SP thymocytes (bottom) in WT, S1pr1-Tg, Pggt1b−/−, and S1pr1-Tg; Pggt1b−/− mice. (G) Chemotactic response of semimature CD4SP (top) and CD8SP (bottom) thymocytes from WT and Pggt1b−/− mice. Migration through 5-µm transwells in response to CCL19, CCL21, and CXCL12 was assessed by flow cytometry after 3 h of treatment. (H) Flow cytometry (top) and real-time PCR (bottom) analyses of CCR7 protein and Ccr7 mRNA expression in mature and semimature SP thymocytes from WT and Pggt1b−/− mice. Numbers in gates indicate percentage of cells. Data are shown as mean ± SEM. *, P < 0.05; **, P < 0.01; two-tailed unpaired Student’s t test in B, D, E, G, and H. Data are from three (A and B), seven (C), two (D, F, and lower panels of E and H), four (G), or five (upper panels of E and H) independent experiments.

