Figure 1.
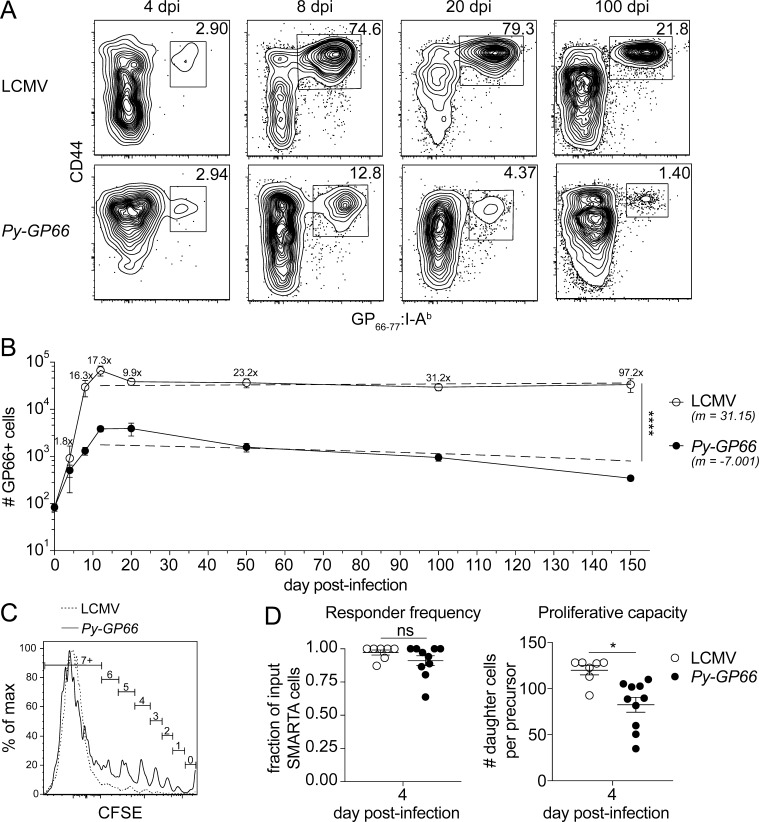
Epitope-specific CD4+ T cells exhibit limited expansion in response to Plasmodium infection. (A) At acute and late time points after infection with LCMV or Py-GP66, the activation and expansion of GP66+ CD4+ T cells from secondary lymphoid organs were assessed by flow cytometry. Plots are gated on dump− CD3+ CD8− CD4+ cells. (B) Graph shows the number of GP66+ cells from both infections over time. The fold change in the cell number from Py-GP66 infection is indicated above the LCMV curve. Data are pooled from four to eight mice from each cohort at each time point from at least two independent experiments. A nonlinear regression from the peak at day 12 to day 150 was performed for each infection and is indicated by the dashed lines. The slope of the Py-GP66 line is −7.001 (−17.75 to 3.747), and the slope of the LCMV line is 31.15 (−170.7 to 233). The regressions were analyzed by F test. (C) CFSE-labeled GP66-specific transgenic CD4+ T cells (SMARTA) were transferred to WT mice and infected with LCMV or Py-GP66. Numbers of cell divisions are indicated on gates. Both histograms are gated on SMARTA+ CD44+ GP66+ T cells. (D) Responder frequency and proliferative capacity of SMARTA+ CD44+ GP66+ cells were calculated as previously described (Gudmundsdottir et al., 1999). Data are pooled from 7–10 mice per cohort from two independent experiments and were analyzed by unpaired t test. For B and D, data are shown as means ± SEM. *, P < 0.05; ****, P < 0.0001. dpi, days post-infection; ns, not significant.

