Figure 4.
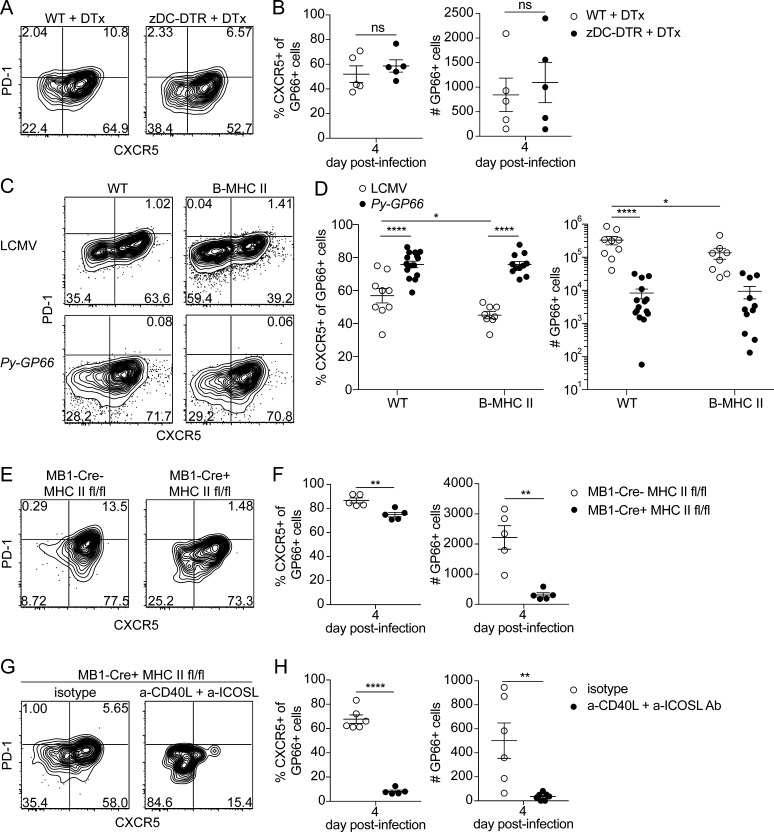
B cells are necessary and sufficient to prime the GP66+ CD4+ T cell response, whereas DCs are dispensable. (A) Representative flow plots of GP66+ cells from 4 d after infection with Py-GP66 in WT and zDC-DTR mice. Both cohorts were treated with diphtheria toxin (DTx) at 1 and 2 d after infection. (B) Summary data of the percentage of CXCR5+ GP66+ cells and number of GP66+ cells in A. Data are pooled from five mice per cohort and are representative of two independent experiments. Data were analyzed by unpaired t test. (C) Representative flow plots showing transferred SMARTA+ GP66+ cells 4 d after infection with LCMV or Py-GP66 in WT and B-MHC II mice. Plots are gated on dump− CD3+ CD8− CD4+ CD44+ GP66+ cells. (D) Summary data of the percentage of CXCR5+ SMARTA+ GP66+ cells and number of SMARTA+ GP66+ cells shown in C. Data are pooled from 8–15 mice per cohort and are representative of three independent experiments. Data were analyzed by two-way ANOVA. (E) Representative flow plots of endogenous GP66+ CD4+ T cells from MB1-Cre− MHCfl/fl or MB1-Cre+ MHCfl/fl mice infected with Py-GP66 4 d prior. (F) Summary data of the percentage of CXCR5+ GP66+ cells and number of GP66+ cells shown in E. Data are representative of five mice per cohort from two independent experiments and were analyzed by unpaired t test. (G) MB1-Cre+ MHCfl/fl mice were treated with a-CD40L + a-ICOSL antibodies or isotype controls daily 0–3 d after infection. Representative flow plots from GP66+ cells 4 d after infection with Py-GP66. (H) Summary data of the percentage of CXCR5+ GP66+ cells and number of GP66+ cells from G. Data are pooled from five or six mice per cohort and are representative of two independent experiments. Data were analyzed by unpaired t test. For B, D, F, and H, data are shown as means ± SEM. *, P < 0.05; **, P < 0.01; ****, P < 0.0001. ns, not significant.

