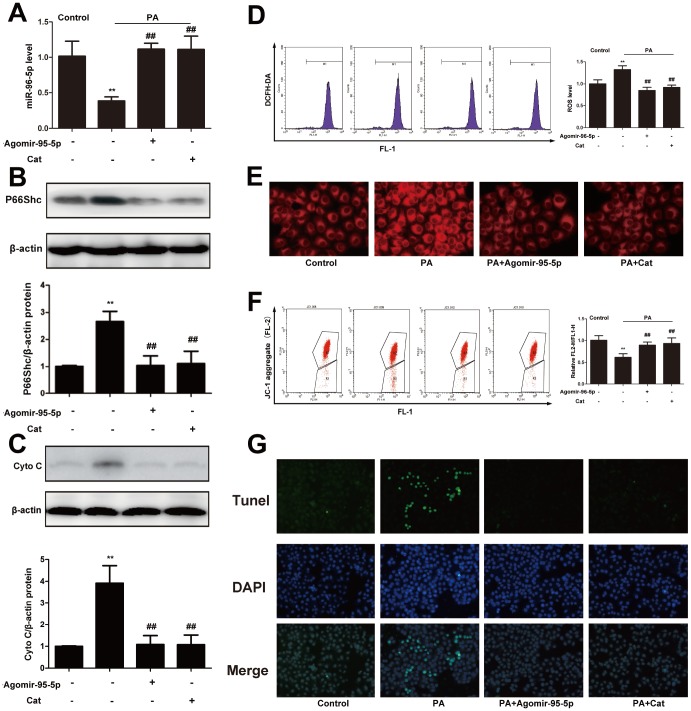
Figure 7.
Catalpol ameliorated oxidative stress, hepatic steatosis and apoptosis through upregulating miR-96-5p. (A) miR-96-5p level. (B) P66Shc protein expression. (C) Cyto C protein expression. (D) ROS level. (E) Nile red staining. (F) JC-1 level. (G) Tunel staining. The results are the mean ± SD (n=8), **P< 0.05 vs. Control group, ##P < 0.05 vs. WD group.

