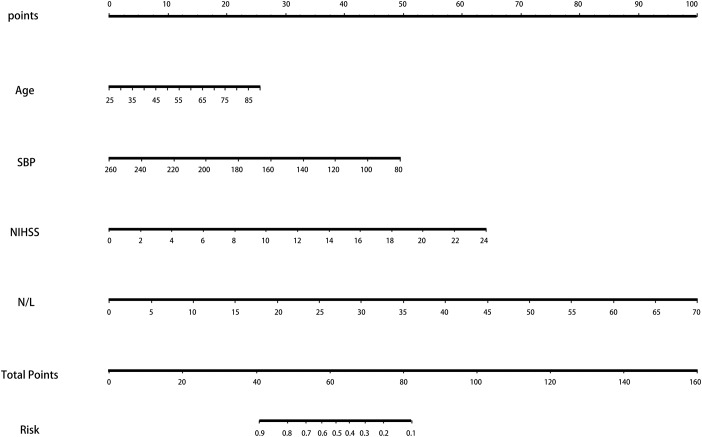
Figure 4.
The nomogram for patients with LAA-type HT. Note: To use the nomogram, an individual patient’s value is located on each variable axis, and a line is drawn upward to determine the number of points received for each variable value. The sum of these numbers is located on the Total Points axis, and a line is drawn downward to the survival axes to determine the likelihood of HT. Abbreviation: LAA: large artery atherosclerosis; HT: hemorrhagic transformation.

