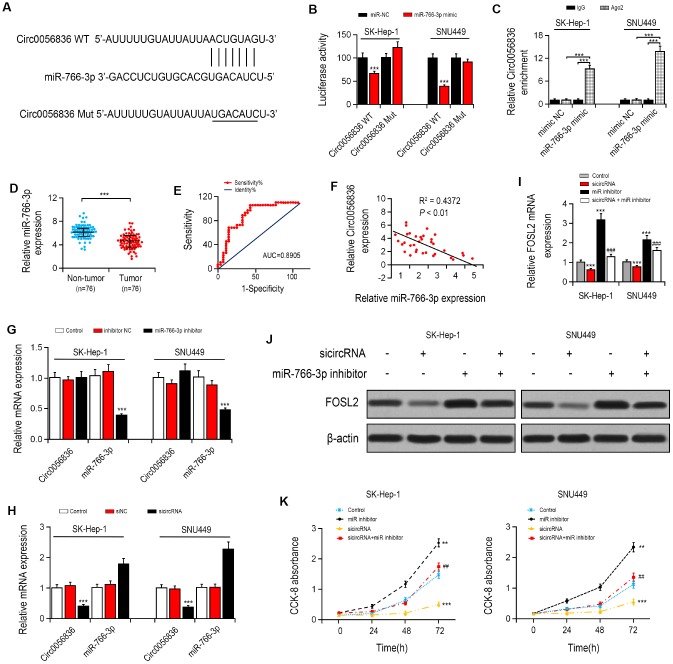
Figure 2.
hsa_circ_0056836 knockdown suppressed cell proliferation in SK-HEP-1 and SNU449 cells. (A) hsa_circ_0056836 WT/Mut was transfected into SK-HEP-1 and SNU449 cells after miR-766-3p mimics transfection. (B) Relative luciferase activity was detected by in SK-HEP-1 and SNU449 cells. (C) Anti-AGO2 RIP was performed in SK-HEP-1 and SNU449 cells after miR-766-3p mimics transfection. (D) miR-766-3p levels were examined in HCC tissues. (E) Area under the ROC curve was 0.8905 (95% CI = 0.8116–0.9427, P < 0.0001). (F) Correlation between miR-766-3p and hsa_circ_0056836 expression in HCC tissues detected by Spearman’s correlation analysis. (G–I) Expressions of miR-766-3p and hsa_circ_0056836 in SK-HEP-1 and SNU449 cells determined by RT-PCR. (J) Expression of FOSL2 in SK-HEP-1 and SNU449 cells after sicircRNA and miR-766-3p inhibitor were suppressed. (K) Cell viability was detected by CCK-8 assay. *P < 0.05, **P < 0.01, ***P < 0.001 vs control group; ##P < 0.01, ###P < 0.001 vs sicircRNA group.

