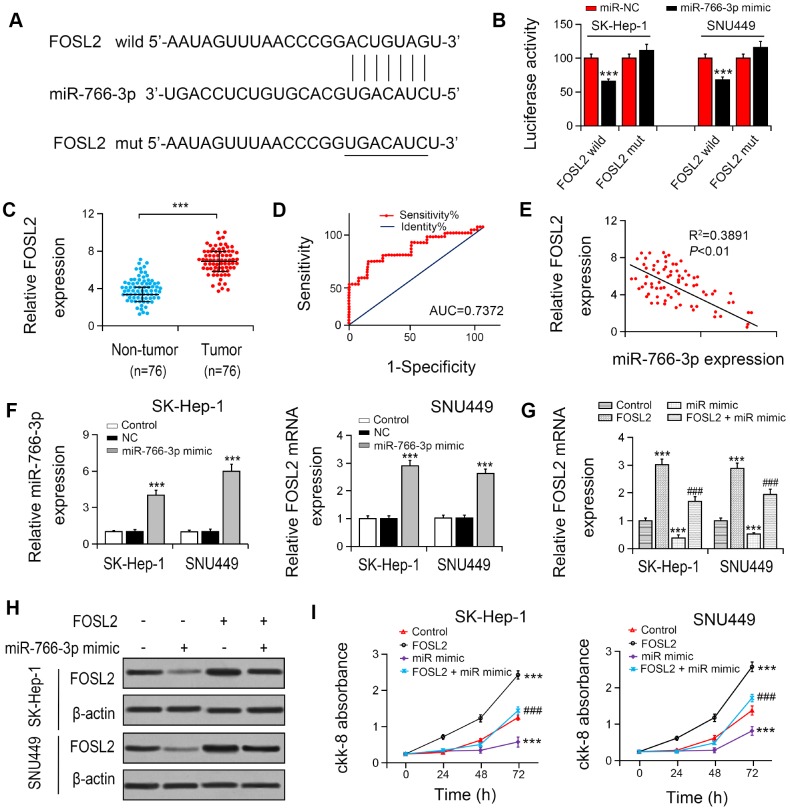
Figure 4.
miR-766-3p suppressed FOSL2 expression in HCC cells. (A) Predicted binding sites of miR-766-3p in the 3’-UTR of FOSL2. (B) Relative luciferase activity in SK-HEP-1 and SNU449 cells after transfection of miR-766-3p mimic/NC or the 3’-UTR of FOSL2 Wt/Mut. (C) FOSL2 level in HCC tissues was detected by RT-PCR. (D) Area under the ROC curve was 0.7372 (95% CI = 0.6530–0.8528, P < 0.0001). (E) Correlation between miR-766-3p and FOSL2 expression detected by Spearman’s correlation analysis. (F) Expression of miR-766-3p and FOSL2 after miR-766-3p or FOSL2 were overexpressed in SK-HEP-1 and SNU449 cells by RT-PCR. (G, H) Expression of FOSL2 in SK-HEP-1 and SNU449 cells after miR-766-3p and FOSL2 were overexpressed. (I) Cell viability in SK-HEP-1 and SNU449 cells determined by a CCK-8 assay. *P < 0.05, **P < 0.01, ***P < 0.001 vs control group, #P < 0.05, ###P < 0.001 vs miR-766-3p mimic group.

