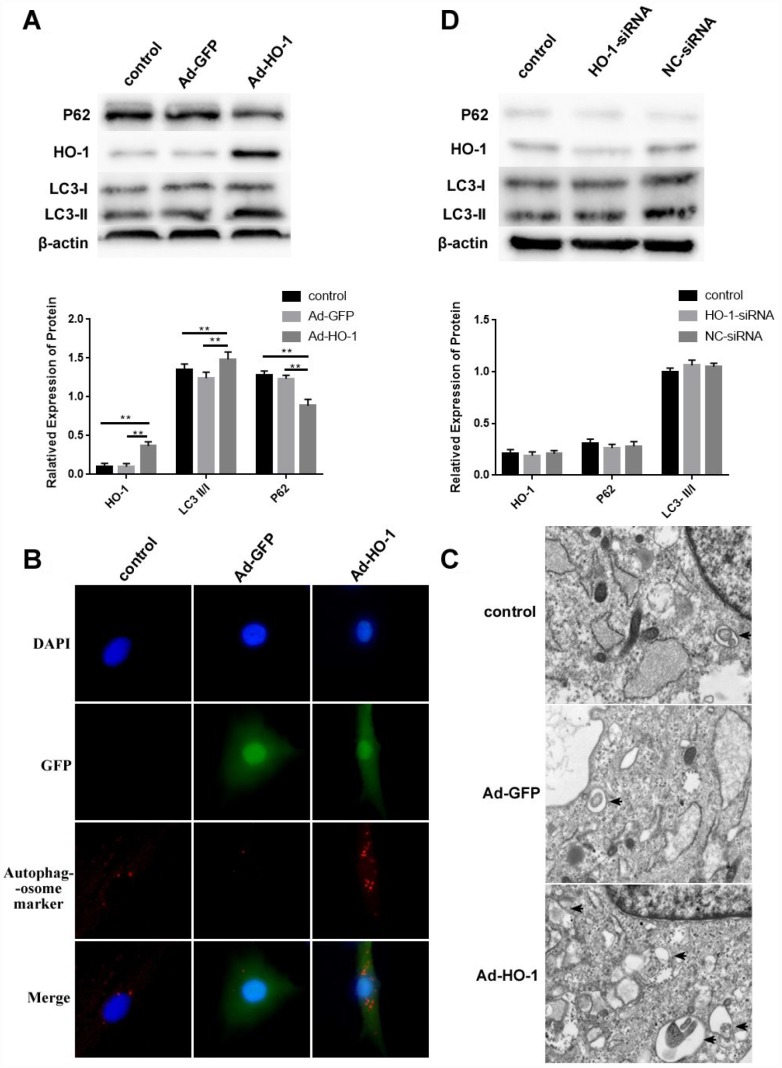
Figure 4.
HO-1 overexpression induces autophagy in human NPCs. (A) Western bolt shows HO-1, P62 and LC3-II/I protein levels in control and HO-1 overexpressing NPCs. HO-1 overexpressing NPCs were generated by transfecting Ad-HO-1 for 48 h. Note: The data represent mean ± SD of three experiments; **p<0.01. (B) Immunofluorescence assay results show autophagosome formation based on staining of the control and HO-1 overexpressing NPCs with antibodies against the autophagosome marker protein SQSTM1/P62. (C) Transmission electron micrographs show characteristic double-membrane autophagosome formation (black arrows) in control and HO-1 overexpressing NPCs. (D) Western bolt shows HO-1, P62 and LC3-II/I protein levels in control and HO-1 siRNA transfected NPCs. As shown, there is no significant difference in the levels of these proteins in all experimental groups. Note: The data represent mean ± SD of three experiments.

