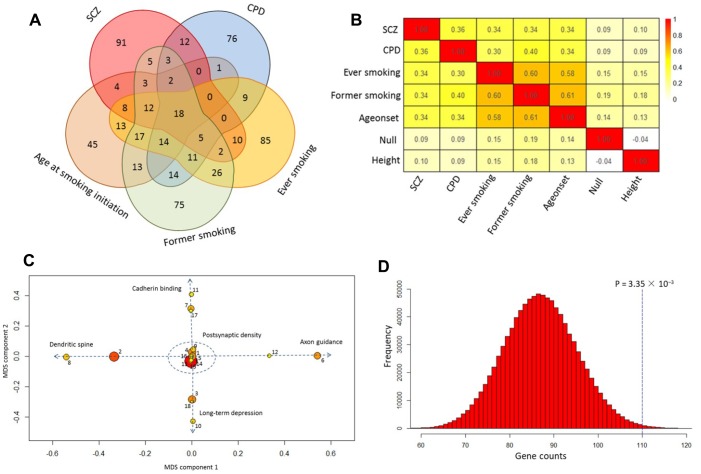
Figure 1.
Shared pathways of SCZ and smoking phenotypes. (A) Venn diagram of significantly enriched pathways (q value < 0.1) for SCZ, CPD, ever smoking, former smoking, and age at smoking initiation. (B) Heatmap of the correlation among SCZ, CPD, ever smoking, former smoking, age at smoking initiation, null, and height based on the Z score of pathway enrichment. (C) Multidimensional scaling plot of 18 shared pathways for SCZ and smoking behaviors. Circular ring sizes reflect number of genes in the pathway (range 18–284). Color indicates the significance of the pathway (red marks the significant pathways with lowest P values). Arabic numerals are the pathway numbers as shown in Table 1. (D) Computer permutation analysis of 590 genes associated with SCZ in 84 shared pathways.

